FOR RELEASE: Tuesday, December 5th, 2023
Contact:
Zac Rogers, Ph.D.
Logistics Manager’s Index Analyst
Associate Professor, Supply Chain Management
Department of Management
Colorado State University
Fort Collins, Colorado
(970) 491-0890
E-mail: [email protected]
http://www.logisticsindex.org
Twitter: @LogisticsIndex
Contact:
Zac Rogers, Ph.D.
Logistics Manager’s Index Analyst
Associate Professor, Supply Chain Management
Department of Management
Colorado State University
Fort Collins, Colorado
(970) 491-0890
E-mail: [email protected]
http://www.logisticsindex.org
Twitter: @LogisticsIndex
November 2023 Logistics Manager’s Index Report®
LMI® at 49.4
Growth is INCREASING AT AN INCREASING RATE for: Warehousing Capacity and Transportation Capacity
Growth is INCREASING AT AN DECREASING RATE for: Inventory Costs, Warehousing Utilization, Warehousing Prices, and Transportation Utilization.
Inventory Levels and Transportation Prices ARE DECREASING
(Fort Collins, CO) — The road to recovery is not always linear – something that is clearly evidenced by the backwards step the Logistics Managers’ Index took this month. November’s Logistics Manager’s Index read in at 49.4, down (-7.1) from October’s reading of 56.5. This dip back into (very mild) contraction ends what had been three consecutive months of expanding rates of growth. The 7.1-point drop is the largest since the start of the ongoing downturn back in April 2022.However, the reason behind this decline is much different than the one from 19 months ago. November’s dip was largely triggered by a decline in Inventory Levels (-9.1) which is attributable to Q4 holiday sales and the subsequent dips in Warehousing Capacity (+3.6) and Transportation Capacity (+5.2) and slowdown in Warehousing Utilization (-14.0) and Transportation Utilization (-10.7). We saw a similar decline in utilization metrics back in April 2022, but in that instance, it was because inventories were holding still.
Essentially, November’s decline seems to have come because firms are selling off inventories quickly. The previous large decline from April 2022 happened because firms had too much inventory and couldn’t sell any of it. Both of these scenarios led to large drops in the overall LMI, but this more recent drop is significantly less concerning.
Researchers at Arizona State University, Colorado State University, Florida Atlantic University, Rutgers University, and the University of Nevada, Reno, and in conjunction with the Council of Supply Chain Management Professionals (CSCMP) issued this report today.
Results Overview
The LMI score is a combination of eight unique components that make up the logistics industry, including: inventory levels and costs, warehousing capacity, utilization, and prices, and transportation capacity, utilization, and prices. The LMI is calculated using a diffusion index, in which any reading above 50.0 indicates that logistics is expanding; a reading below 50.0 is indicative of a shrinking logistics industry. The latest results of the LMI summarize the responses of supply chain professionals collected in November 2023.
As with every report chronicling the month of November, we should begin the discussion with “Cyber Week” – the five-day period between Thanksgiving and Cyber Monday that has often functioned as the true kickoff to holiday spending. According to the National Retail Federation 200.4 million shoppers made purchases between Thanksgiving and Cyber Monday. This was significantly higher than predicted turnout. Consumers spent $12.4 billion on Cyber Monday and $38 billion in online sales across Cyber Week which is up 7.8% from 2022[1]. The jump in sales at the end of the month is a potential explanation for the increase in activity we see in the second half of November. The increase did not only come from ecommerce, as physical retail store traffic grew as well, up 1.5% from 2022[2]. Electronics, apparel, furniture, groceries, and toys led the way, accounting for 60% of all consumer spending in November[3],[4]. One interesting note on the spending is that the use of “buy now pay later” providers and eschewing the use of the store credit cards which had previously been so lucrative for retailers. This shift in the use to the type of credit consumers are using is likely partially due to the changing demographics of shoppers, with younger spenders less drawn to high-interest cards for multiple stores when compared to previous generations.
This wave of spending comes after consumer spending was only up 0.2% in October, which was the slowest increase in spending since May – which is one of the reasons Inventory Levels had built up last month. The low spending was a major contributor to the continued slowdown of inflation[5]. This dip was also reflected in the San Francisco Fed’s measure of inflation factors, which showed demand as being deflationary in October, the first time since January 2022 when consumers first started stepping back from the record spending of 2021[6]. The Fed is not ready to say that they are through raising interest rates. However, given the continued improvement in their preferred inflation metrics, it seems unlikely they will raise rates at their December meeting. Whether or not this is indicative of an eventual reduction in rates remains to be seen[7]. If consumer spending is muted through the end of the year, a rate reduction may enter into the realm of possibility. Markets seem to be expecting this possibility. In the U.S., the Dow rose for the fifth consecutive week at the end of November which marks its longest period of expansion since 2021. The S&P 500 and Nasdaq have increased over the last five weeks as well as investors grow more hopeful of a slowdown in interest rates[8]. LMI respondents are optimistic about growth in the logistics industry over the next 12 months. For that growth to occur it is likely that the predicted relaxation in interest rates will have to have happened first.
Despite the dip in the overall LMI (-7.1) to the very mild rate of contraction of 49.4, the North American economy continues to chug along. The “earnings recession” that U.S. firms had been mired in seems to have ended. Earnings had been down since Q4 of 2022 but rebounded in Q3 2023 with corporate profits reaching a total of $3.28 trillion – just shy of the all-time record of $3.3 trillion set in Q3 of last year[9],[10]. However, as has been the case through most of 2023, this recovery is not consistent across the globe. The slowdown in the Panama Canal is sending fuel prices skyrocketing in Asia as the LPG carriers are being given last priority (behind passenger and cargo ships) to get through the canal[11]. This could potentially lead to inflation in Asia this winter as heating becomes more expensive. This would be particularly unwelcome news for China, which is already struggling due to low consumer demand fueled by their faltering real estate market and continually contracting factory activity[12]. Sailings through the Panama Canal will be restricted through at least February. High fuel prices for the world’s second-largest economy could potentially have ripple effects around the world. Conversely, the economic situation in India continues to improve, as inflation has eased, and demand has continued to grow for the country that now has the largest population in the world[13]. How this growth might be impacted by slowdowns in the Panama Canal remains to be seen. Another byproduct of the issues with the Panama Canal is more freight shifting back to the Pre-Covid pattern of coming in through West Coast ports, eschewing the Gulf and East Coast ports that had seen a spike in activity over the last few years. This has led to a reversion of volumes, with places like the Atlanta market down 11% year-over-year but Ontario California up 14%[14]. This overloading of freight to one side of the country is less of an issue now when capacity is high. However, as supply and demand move back towards equilibrium, the geographic concentration of freight could lead to issues with cost on the West Coasts, and availability in the East.
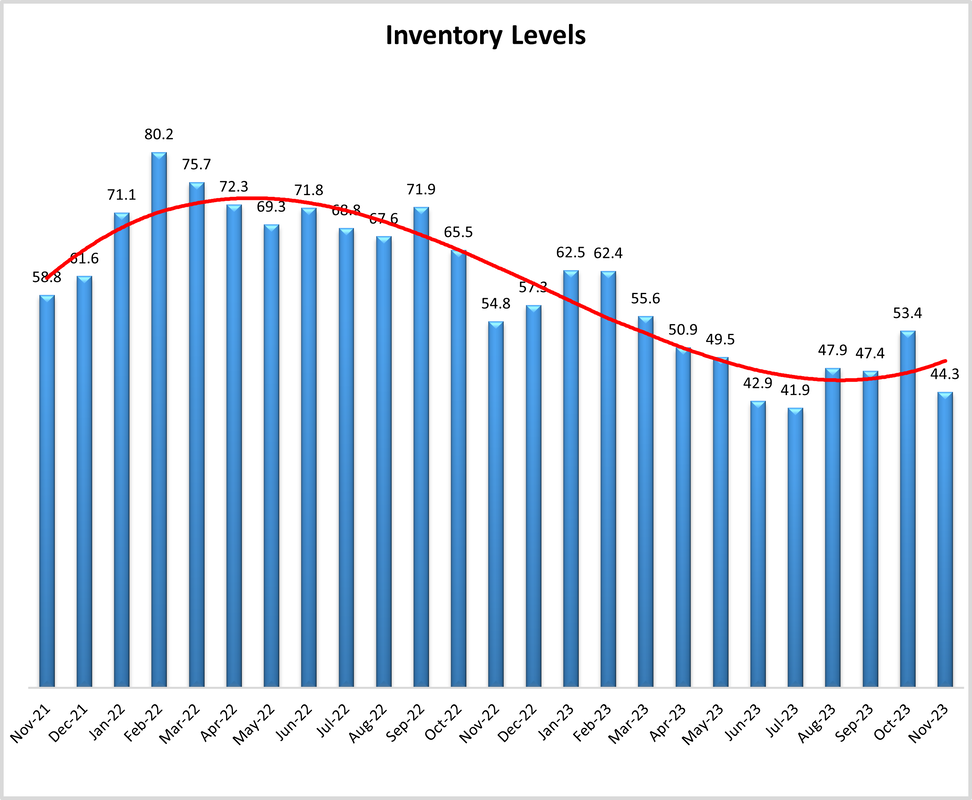
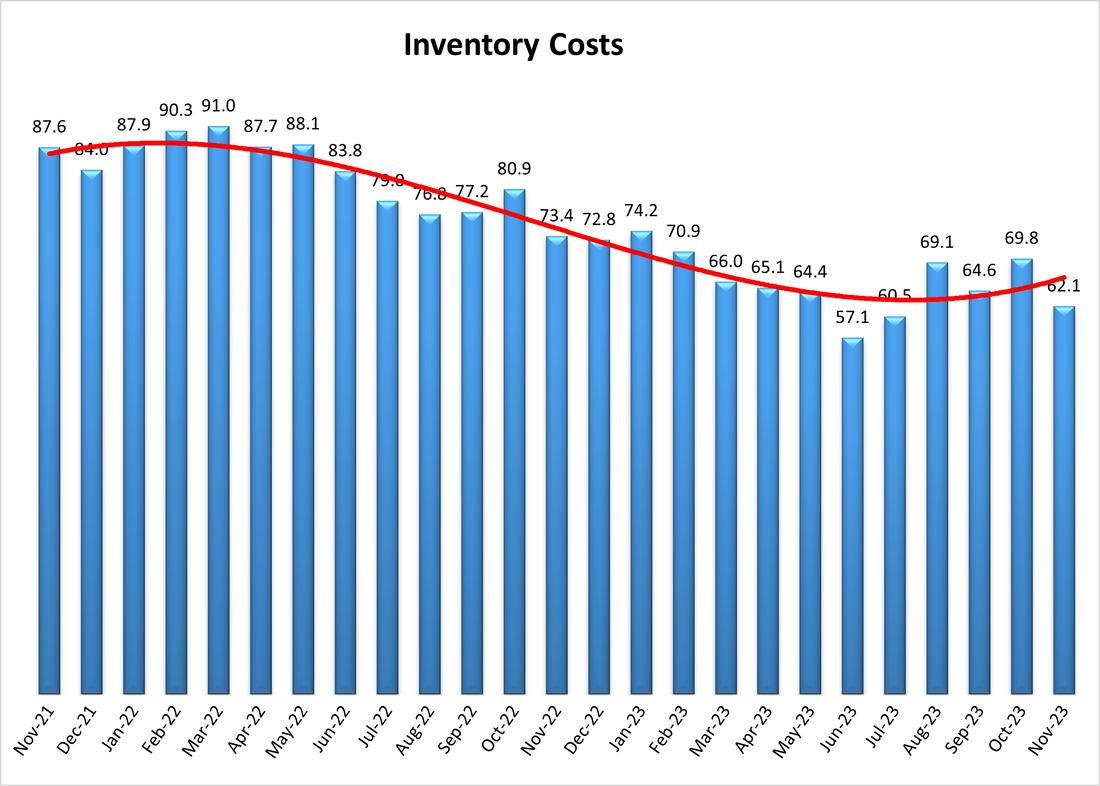
As mentioned above, much of the decline in this months’ LMI is attributable to shifts in inventories. Inventory Levels are down (-9.1) to 44.3, putting them squarely back into contraction territory after a one-month reprieve. This is consistent with anecdotal inventory reports. Several large retailers including Dick’s, Walmart, and Target have purposely kept inventories low. Target epitomizes this strategy as their inventory was down 14% year-over-year at the end of Q3[15]. This seems to be further evidence for the move towards JIT strategies that we have discussed for the last several months in this report, as well as an explanation for the declining inventories we saw in November. Retail sales are expected to be up slightly in from last year, so it remains to be seen whether the cuts to inventory were too deep and will lead to missed sales, or if they are exactly what the doctor ordered after the inventory boondoggle many firms faced in 2022. Perhaps tellingly, Downstream retailers are looking to keep Inventory Levels low at a level of 41.5 over the next 12 months, while their Upstream counterparts look to be somewhat aggressive in building inventories back up at a level of 54.7. It will be interesting to see how inventories are affected some large retailers turning towards AI to determine inventory levels. The swift adoption of this technology is at least partially due to the unprecedented swings baked into the historical sales data over the last few years, making classic historical forecasting techniques somewhat unreliable. The hope is that AI generated forecasting will also make planning more dynamic and help companies to avoid disruptions[16]. An additional reason for firms to be aggressive in adopting cognitive technology is to bring down Inventory Costs, which though down (-7.6) continue to increase at a rate of 62.1 and have still never contracted.
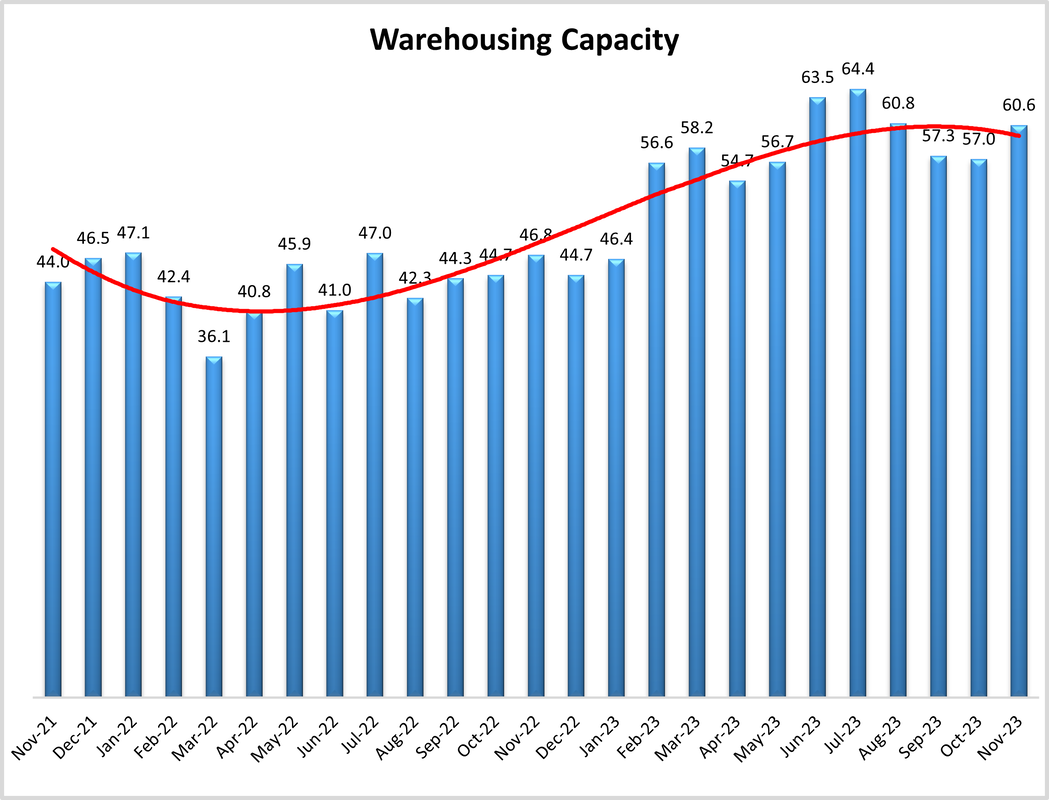
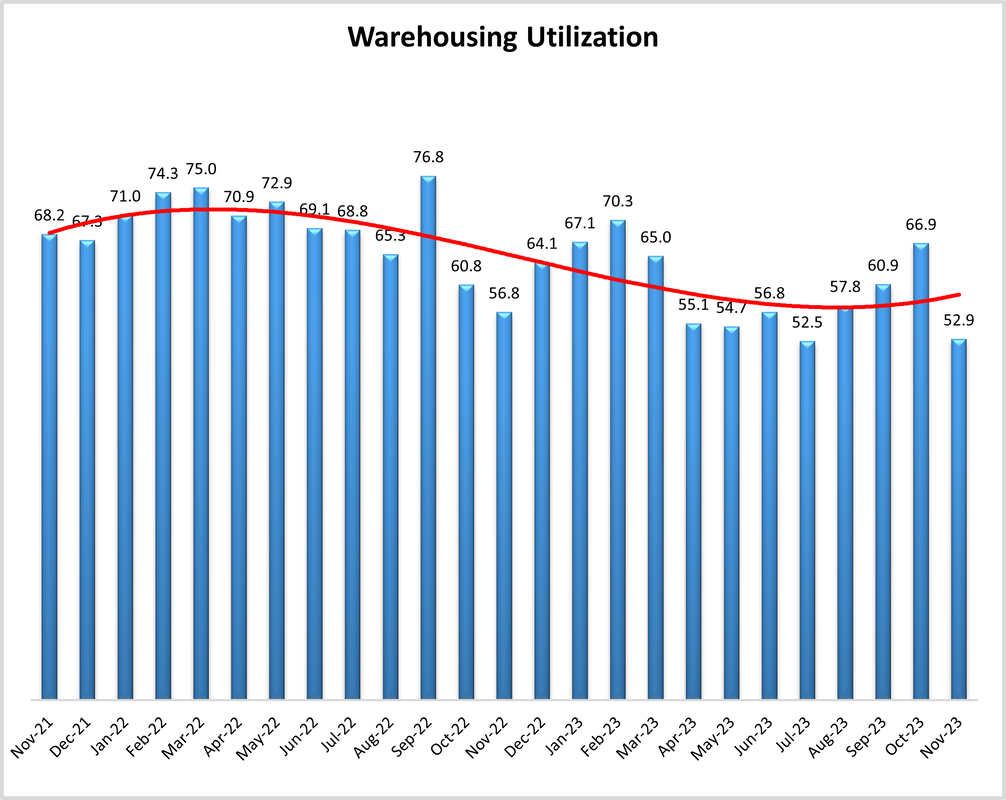
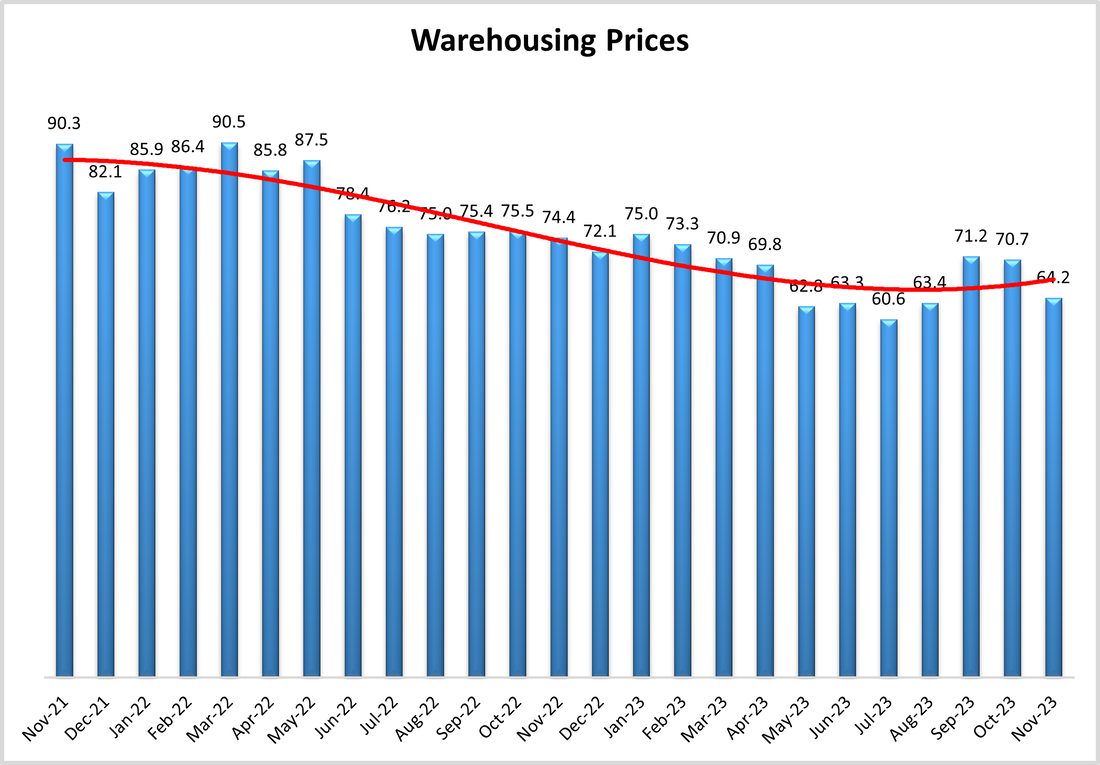
Perhaps the primary reason that Inventory Costs continue to rise in spite of declining Inventory Levels is the continued tightness in the warehousing market. Warehousing Capacity did move up (+3.6) to 60.6 in November, but the increase capacity was not enough to sate the continuous growth in the cost of storage. While space has come online, there is still not enough square footage of the fulfillment space in urban areas that will allow for the efficient last-mile delivery consumers crave. Firms are taking several different approaches to dealing with this lack of space. Walmart will add parcel stations to 40 of its stores across nine states by the end of 2023. The purpose of these stations is to facilitate last mile delivery, relieving pressure from their warehouse and distribution network[17]. Similarly, in mid-November Walgreens announced a plan to pivot towards fulfillment out of their brick-and-mortar stores. While this has been tricky for other large retailers, Walgreens hopes that their dense network of stores – of which one is within 5 miles of 78% of all Americans – will allow them to increase service levels and decrease shipping costs[18]. Even social media platform TikTok is getting in on the act, committing significant resources to new logistics functionalities to bolster the ecommerce sales that drive their revenue stream[19]. It is no coincidence that it is large retailers who are taking these significant steps. While Warehousing Utilization is still growing at a rate of 52.9, it is down significantly (-14.0) from October’s reading. However, as with many aspects of the logistics industry, this decline is not uniform. The slowdown in the expansion of utilization was largely driven by a slight contraction by Upstream firms (48.8). Conversely, Downstream firms (which would include the retailers discussed above) are reporting continued expansion in Warehousing Utilization at 59.8. The lack of the appropriate space is represented in Warehousing Prices (-6.5) which continued to increase in November at a rate of 64.2. The high cost of space will likely continue to be an issue across the supply chain going forward, Warehousing Prices are predicted to continue steadily increasing by both Upstream (62.1) and Downstream (69.7) respondents. The rate of expected growth for respondents is nearly 70.0, which we classify as a significant rate of expansion. Clearly, our respondents are expecting 20024 to be another strong year for the warehousing market.
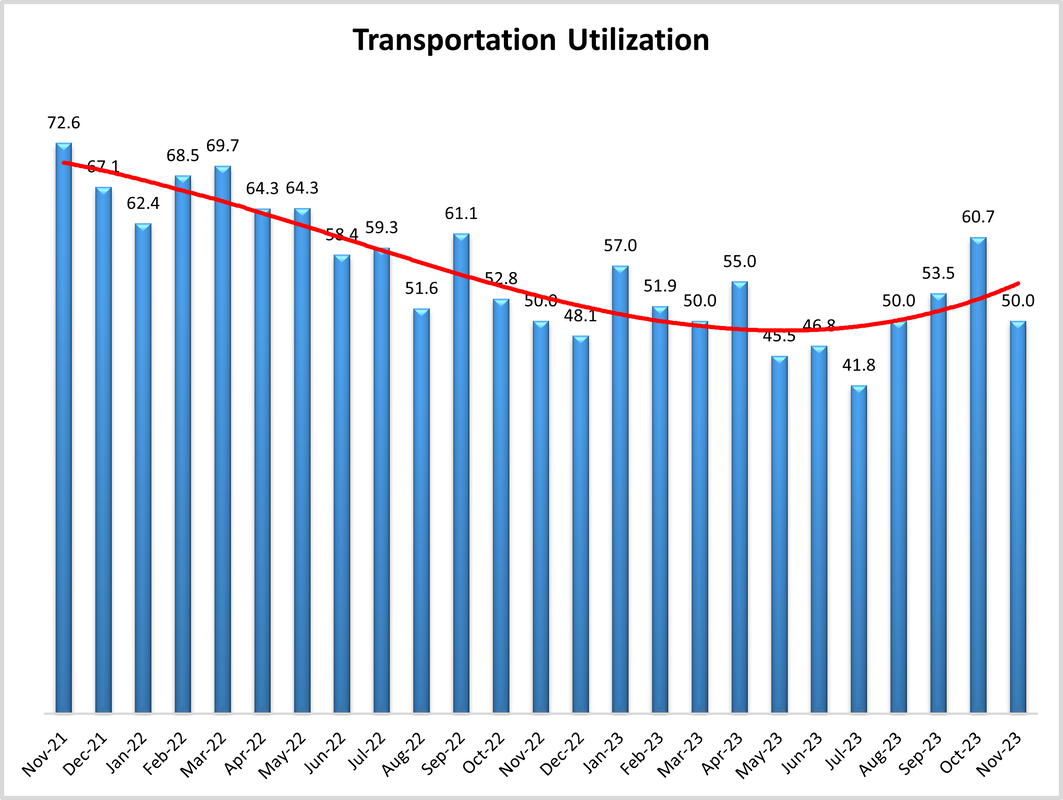
There is also optimism regarding transportation. However, unlike warehousing, the predicted growth in transportation is only hypothetical, and has not yet been realized at all levels of the supply chain. Transportation metrics are down overall but remain strong at the Downstream retail level. For instance, overall Transportation Utilization is down considerably (-10.7) to 50.0 – indicating no movement – when we only consider the macro level. However, if we drill down we find that Upstream firms reported contraction (47.9) while their Downstream counterparts saw continued expansion (55.1). The increased activity Downstream is exemplified by Amazon, which surpassed UPS to become the largest parcel carrier in the U.S. last year, announcing that they had delivered 4.8 billion packages before Thanksgiving. They are projecting total deliveries of 5.9 billion parcels by the end of 2023[20], suggesting that nearly a fifth of their annual volume will move over the next month. UPS may be making up some of the volume on the reverse side, as signaled by their agreement to acquire Happy Returns from PayPal[21]. Returns often peak right after the holidays, and the reverse play could be successful for UPS going into 2024. As exemplified by the extreme lack of enthusiasm shoppers are showing to the retailers who are trying to normalize paying for returns[22], reverse logistics and the associated transportation that goes along with it is very likely to continue growing for the foreseeable future.
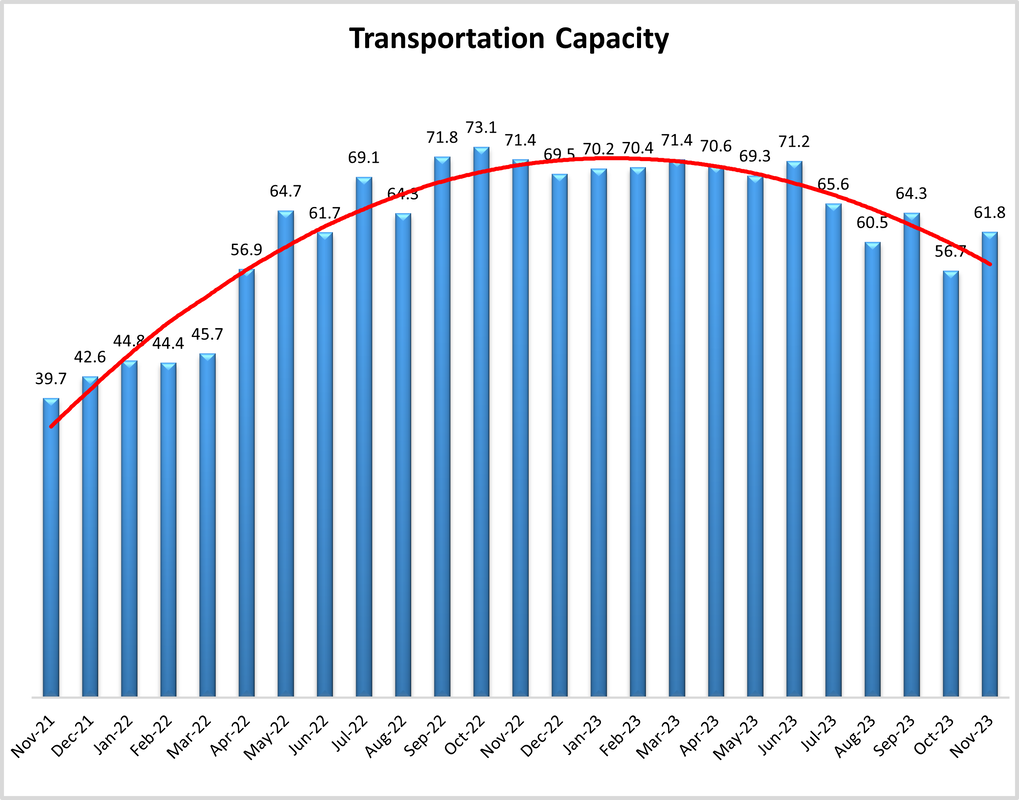
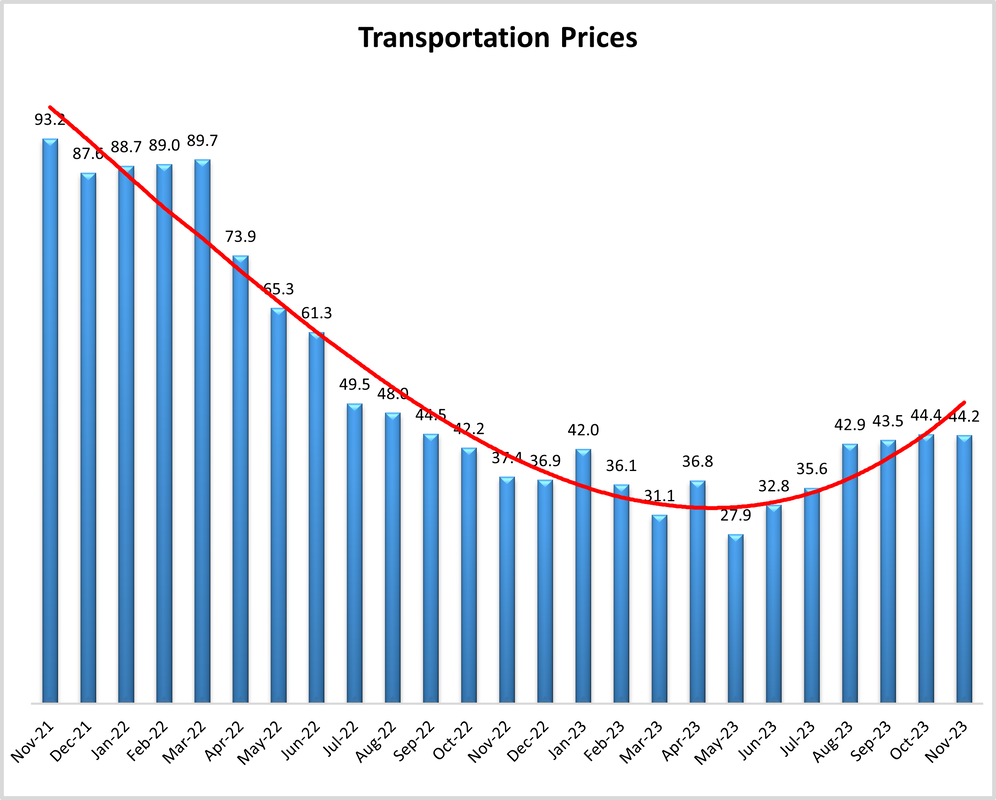
Similar to what we saw with utilization, Transportation Prices are down (-0.2) overall to 44.2. This is the first slowdown in this metric since May – although it should be noted that outside of October’s reading of 44.4 it is the highest score for this metric in over a year. Once again, we see a notable difference between Upstream (41.5) and Downstream (50.0) respondents. While prices did not increase Downstream, they did hold steady after October’s growth, and were much higher in the second half of November once last-mile deliveries for holiday goods picked up. If regular seasonality holds, we are likely to see higher Downstream activity continuing through December while their Upstream counterparts remain slow until the new year. Whatever the case ends up being, there will be plenty of Transportation Capacity, which is up (+5.2) to 61.8 in November. Unlike the other two transportation metrics, Transportation Capacity is growing faster Downstream (65.4) than Upstream (59.9). Trucks are easier to build than warehouses, and it seems that the capacity that will be needed to facilitate ecommerce growth moving forward is ready in a way that the fulfillment centers are not.
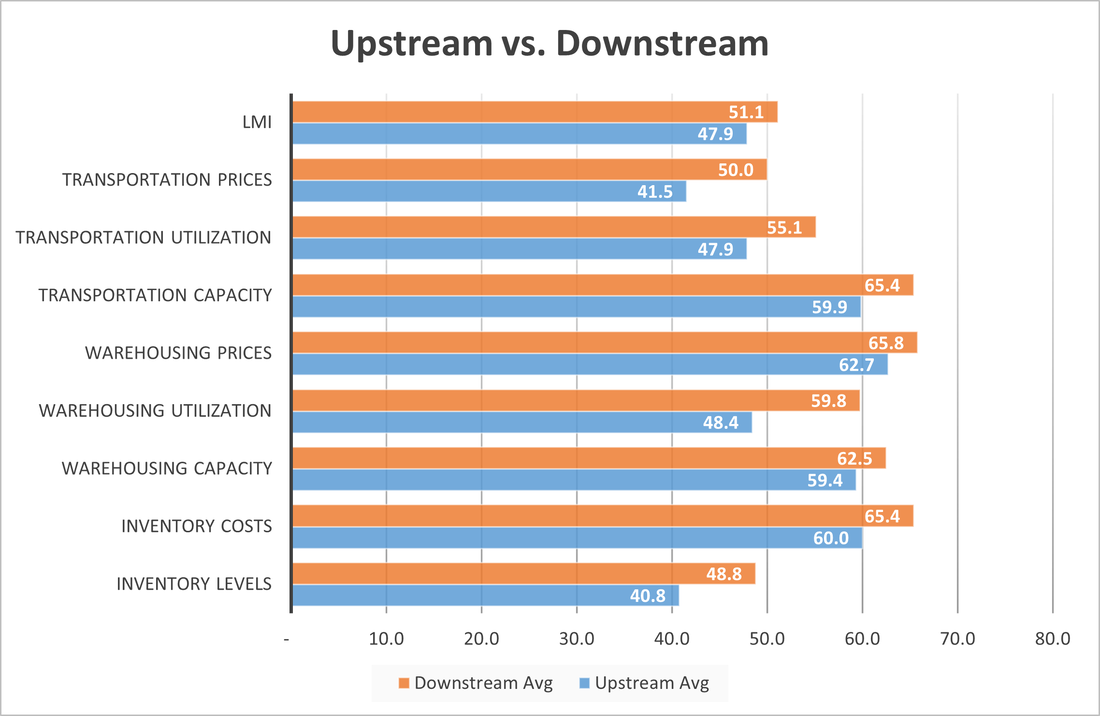
The logistics industry is not a monolith and is not contracting across all parts of the supply chain. Although we see contraction overall and from our Upstream (blue bars) respondents, Downstream respondents orange bars) are still seeing some growth. Inventory is contracting slower Downstream (48.8 to 40.8). Downstream firms are seeing Warehousing Utilization growing at a significantly faster rate (59.8 to 48.4), Transportation Price is holding steady rather than contracting (50.0 to 41.5) and Transportation Utilization expanding rather than contracting (55.1 to 47.9). Taken altogether, this suggests that inventories were pushed towards consumers, and last-mile deliveries are ongoing, leading to the higher levels of Transportation Utilization Downstream (despite the higher Transportation Capacity expansion Downstream). The low levels of inventory across the supply chains is consistent with the anecdotal evidence discussed above. Interestingly, Upstream firms are predicting increases in Inventory Levels going forward, while Downstream is not. If those predictions hold, we may eventually see freight rates increasing Upstream as well as Downstream.
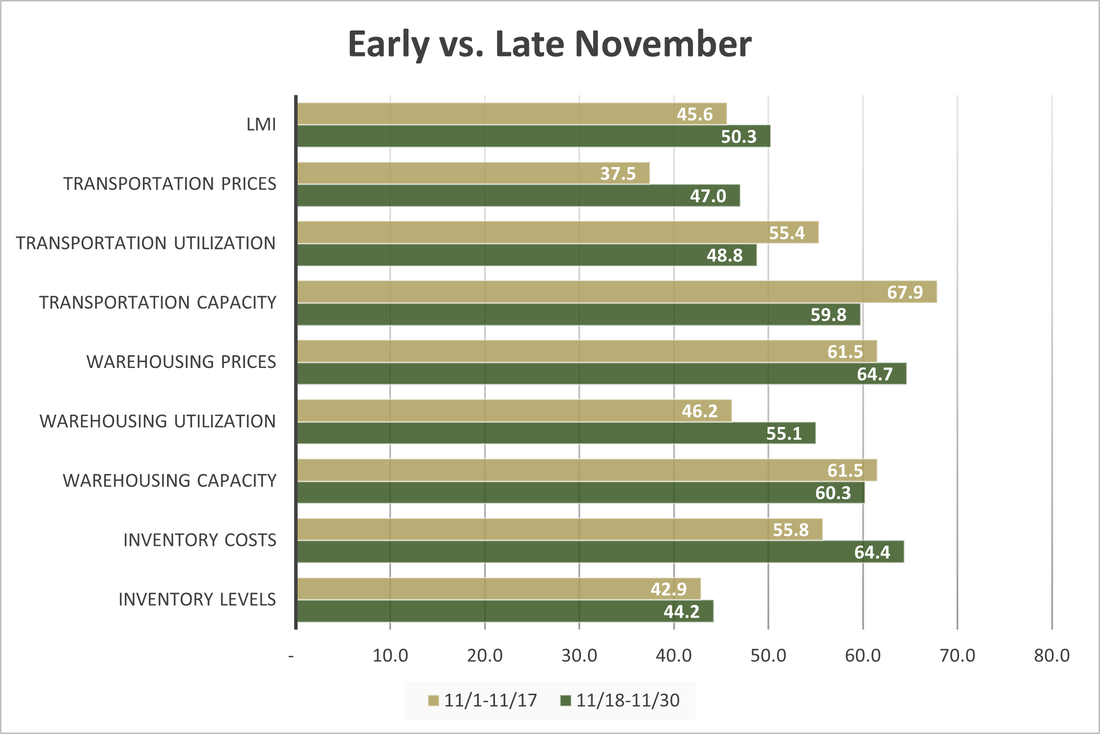
Responses varied slightly from early (gold bars) to late (green bars) November. There were no statistically significant differences, but every metric other than Transportation Utilization indicated more activity in the second half of the month (the capacity metrics decreased – signaling tightening capacity). Inventory Costs, Warehousing Utilization, and Transportation Prices took the biggest jumps in the second half of the month. This is likely a result of the record spending seen during the Thanksgiving cyber week. It is unclear whether the slowdown from the beginning of the month was the deep breath before the plunge into holiday spending, or if the spike at the end of November was just seasonal activity that will fade away as Q4 goes on.
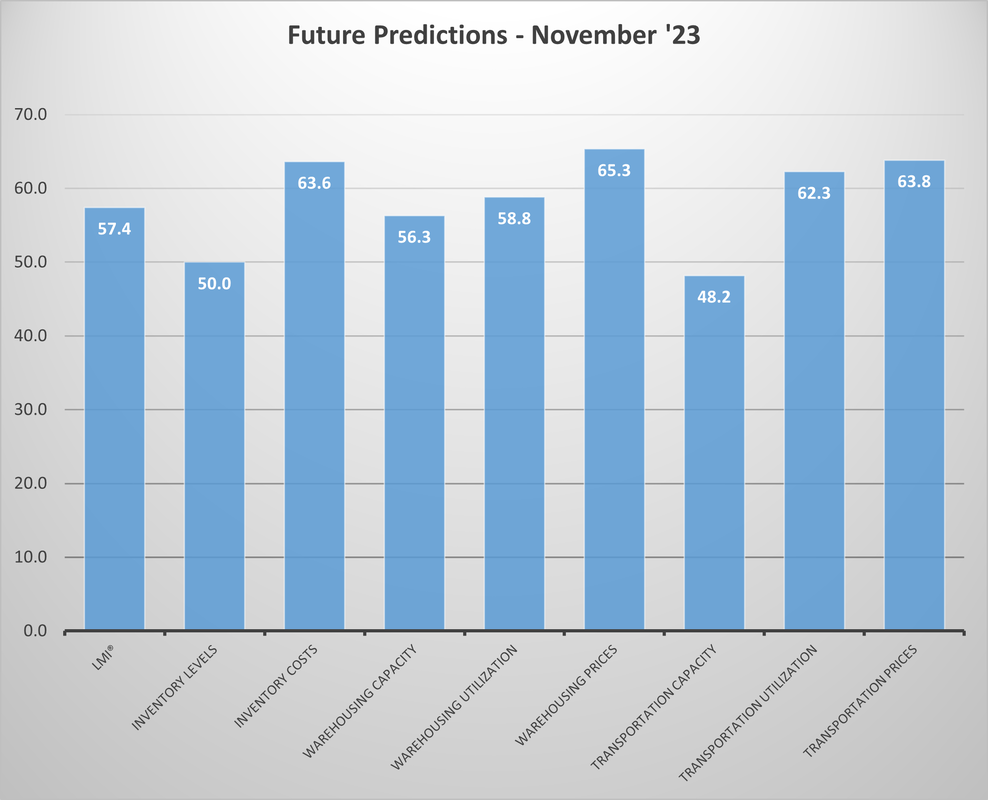
Respondents were asked to predict movement in the overall LMI and individual metrics 12 months from now. Future expectations remain optimistic about the future, although slightly less than they did in October. The overall index prediction is 57.4, which is slightly down (-3.4) from October’s prediction of 60.8 but would still represent a level of growth not seen since early in 2022. Interestingly, respondents are predicting Inventory Levels to “stay flat” at 50.0. As will be seen below, this is largely driven by a plan to reduce inventories Downstream in an attempt to adopt a more JIT-style of inventory management. Warehousing and transportation metrics all show growth, with Transportation Prices (63.8) and Capacity (48.2) still predicted to invert sometime in the next 12 months, suggesting that supply and demand will have moved back into equilibrium, ending the freight recession that began late last Spring. Respondents are also expecting Warehousing Capacity (56.3) to continue to expand modestly, but not quick enough to significantly slow down the expansion of associated Warehousing Prices (65.3).
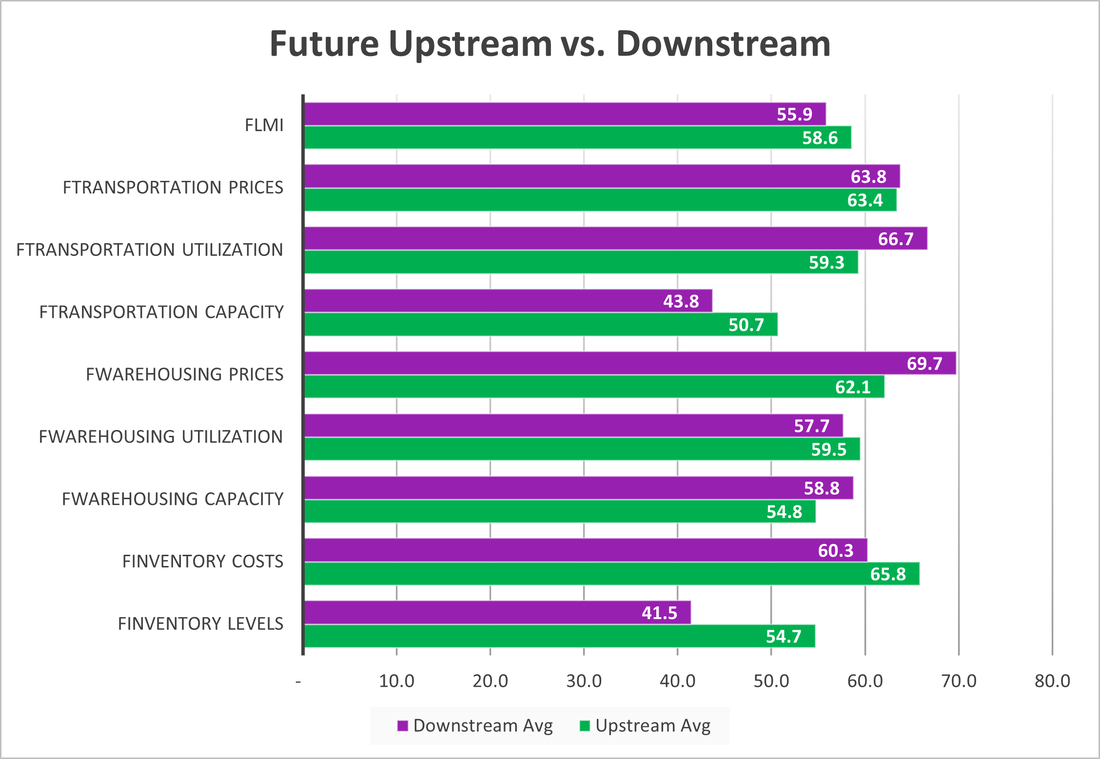
Unlike what we have seen through most of 2023, optimism regarding future changes comes from more from our Upstream respondents (green bars) than from their Downstream (purple bars) counterparts. After a year or dormancy, Upstream firms are expecting significantly faster increases in Inventory Levels (54.7 to 41.5), with higher corresponding levels of Inventory Costs (72.1 to 55.8), as well as busier rates of change in tow of the three warehousing metrics. Other than contracting inventories Downstream firms do report growth across nearly every metric going forward, particularly in the case of transportation metrics, where it is the Downstream firms expecting busier readings across all three metrics. Growth is predicted across all levels of the supply chain, but when taken altogether, Upstream firms are predicting a greater level of growth in the overall index at a rate of 58.6 to 55.9. If these predictions come to pass it will mean that the Upstream part of the supply chain is “waking up” and would be a notable shift 2from the trends we have seen for much of the last year.
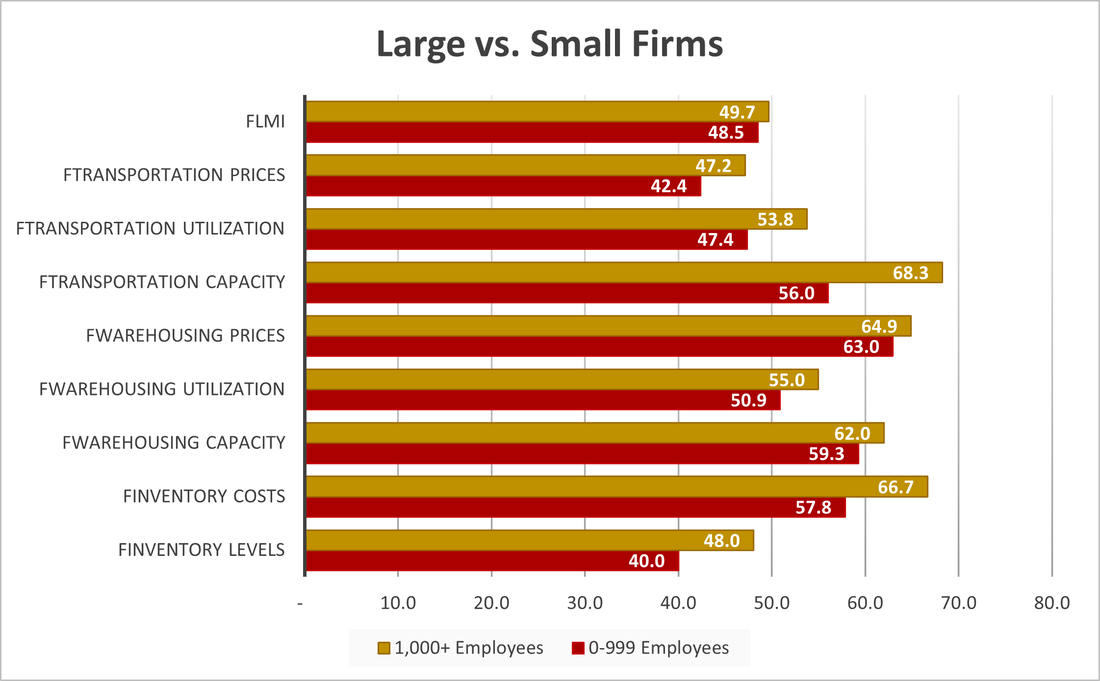
When comparing larger firms (those with 1,000 employees or more, represented by gold lines) and from smaller firms (those with 0-999 employees, represented by maroon lines) we see the reverse of what we saw last month. In November smaller inventories contracted at a rate of 40.0 – down 18.0 points from their expansion of 58.0 in October. Large firms meanwhile were consistent month-to-month (47.4 to 48.0). This is supportive of the theory put forth last month that smaller firms were stocking up for Q4 at the last second while big firms maintain a somewhat consistent JIT flow where inventories are held fairly constant through the holiday shopping season. Larger firms also seem to have access to significantly more Transportation Capacity. Despite this, they also report greater rates of Transportation Utilization and slower rates of contraction for Transportation Prices.
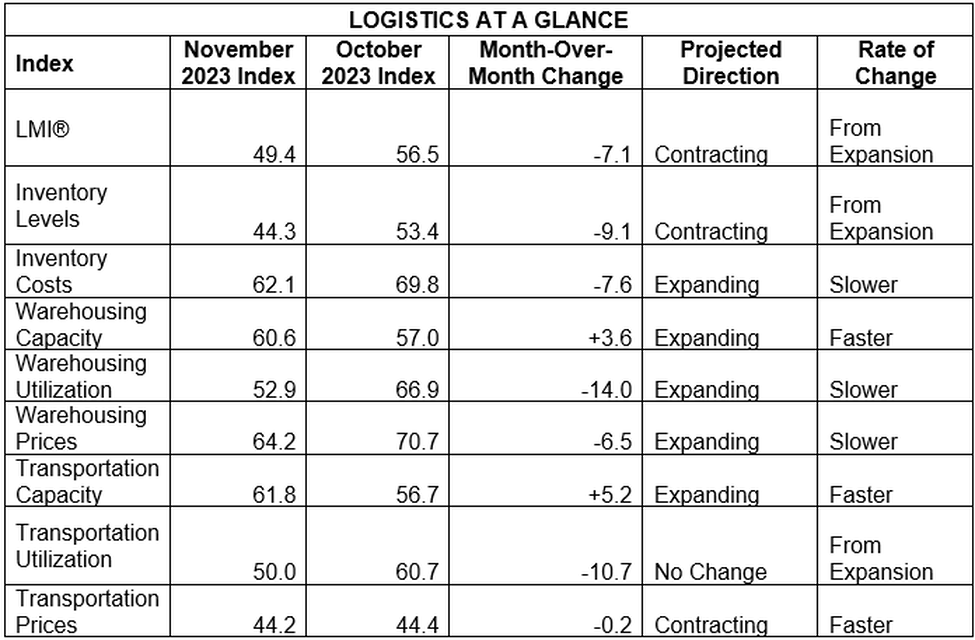
The index scores for each of the eight components of the Logistics Managers’ Index, as well as the overall index score, are presented in the table below. The overall index is back to a very slight level of contraction following a run of expansion over the previous three months. We also see contraction in Transportation Prices and Inventory Levels (which had expanded in October). Transportation Utilization held steady reading in at 50.0 and the other five sub-metrics showed some level of expansion (including increase rates of expansion for both capacity metrics, which generally indicate a slowdown in the logistics market).
The index scores for each of the eight components of the Logistics Managers’ Index, as well as the overall index score, are presented in the table below. The overall index is back to a very slight level of contraction following a run of expansion over the previous three months. We also see contraction in Transportation Prices and Inventory Levels (which had expanded in October). Transportation Utilization held steady reading in at 50.0 and the other five sub-metrics showed some level of expansion (including increase rates of expansion for both capacity metrics, which generally indicate a slowdown in the logistics market).
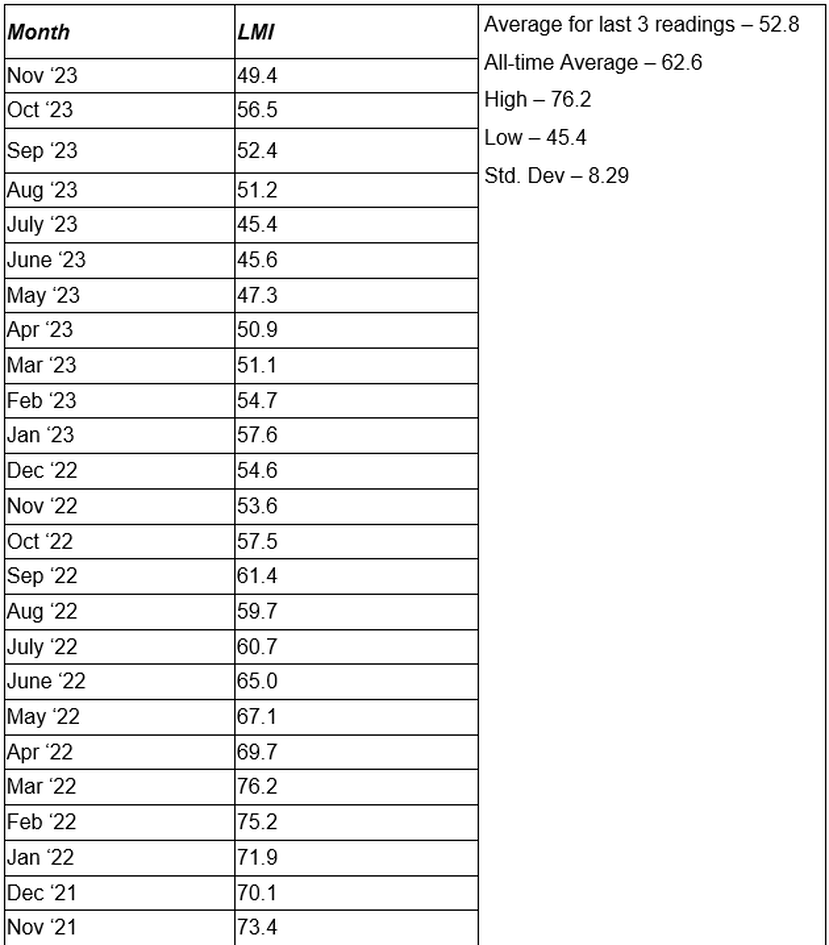
Historic Logistics Managers’ Index Scores
This period’s along with prior readings from the last two years of the LMI are presented table below:
This period’s along with prior readings from the last two years of the LMI are presented table below:
LMI®
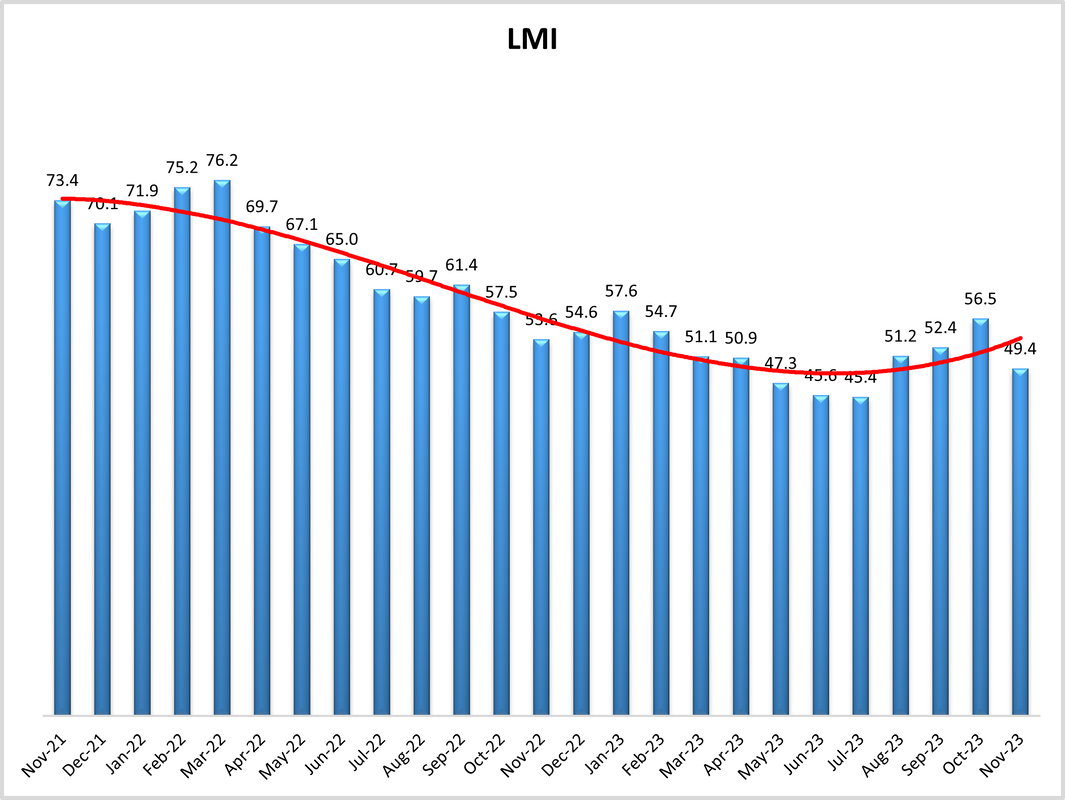
The overall index reads in at 49.4 in November. This is back down (-7.1) from October’s reading of 56.5 – putting the overall index back into reduction territory. This is a marked change for the overall index which had been expanding for the past three months and is the largest drop since the start of the ongoing downturn back in April 2022.This is not necessarily an echo of that shift however, as this one seems to have been largely triggered by a sell-off of inventories, while the 2022 dip was more due to excess inventories and plummeting freight rates. It is also worth noting that the LMI did actually continue to expand for Downstream firms (51.1), with the slight move into contraction originating with our Upstream respondents (47.9) (although the overall index was down on both sides).
Despite the move towards contraction, respondents remain optimistic regarding future growth. The predicted expansion rate over the next 12 months is 57.4, which is down (-3.1) from October’s future prediction of 60.8 but is still comfortably into expansion territory. In a flip of what we see today, Upstream firms are slightly more optimistic than their Downstream counterparts (58.6 to 55.9), perhaps reflecting a coming increase in manufacturing and B2B commerce.
Inventory Levels
The Inventory Level value is 44.3 in November, down (-9.7) from October’s reading of 53.4. After one month of expansion inventories have now contracted in six of the last seven months. As discussed above, much of the decline seems to be due to moving goods to customers and also having many of those goods purchased at the end of the month. Upstream respondents averaged 40.8, while downstream averaged 48.8. Downstream respondents were close to no change – reflecting a JIT strategy – while Upstream showed a significant reduction as goods were moved to customer firms. Similarly, we see small firms had an average value of 40.0, while larger firms averaged 48.0.
When asked to predict what conditions will be like 12 months from now, the average value is 50.0, indicating literally no change, which is higher than the current index value of 44.3. Upstream respondents predicted an increase of 54.7, while Downstream respondents actually predicted a decrease of 41.5.
Inventory Costs
Inventory costs are at 62.1 in November, down (-7.7) from October’s reading of 69.8. The index is 7.7 units lower than last month. It is 11.3 points lower than last year, and 25.5 points lower than two years ago – reflecting success in the ongoing strategy to get costs (and as a byproduct inflation) down from 2021-2022. Upstream (60.0) and Downstream (65.4) respondents both observed an increase in costs despite the drop in overall levels. In the past low Inventory Levels and high Inventory Costs have been indicative of goods moving more quickly – something that may be happening as consumers engage in holiday spending. Inventory Costs were up significantly in the second half of November relative to the first half (64.4 to 55.8), which lends credence to the theory that costs were driven up at least partially be velocity. We also observe a difference with Small (57.8) and Large (66.7) firms – consistent with the higher levels of activity we see for larger firms across other metrics.
Predictions for future Inventory Cost growth are 65.8, down (-1.1) from October’s future prediction of 66.9. Interestingly, Upstream respondents’ future predictions averaged 65.8, while Downstream respondents averaged 60.3, a more modest increase. These increases were consistent with the expected increases in inventory.
Warehousing Capacity
The November Warehousing Capacity index registered in at 60.6 reflecting a 3.6-point increase from the month prior, which is also up by over 14-points from the reading from one year ago (46.8) and up approximately 18-points from the reading two years ago (44.0). The split between Upstream (59.4) and Downstream (62.5) was not statistically significant this month, although there is slightly more space coming online for retailers. Additionally, the split between small firms with <999 employees registered in at 59.3 whereas those firms with larger numbers of employees (greater than 1000) registered in at 55.0, yet the difference was not statistically significant.
Future predictions suggest capacity will come online slowly over the next year as respondents are expecting an expansion rate of 56.3, up slightly (+0.5) from October’s future prediction of 55.8. Future predictions vary slightly by supply chain position, Downstream firms are predicting levels of growth rate a rate of 58.8 while the Upstream counterparts predict growth of 54.8. Any capacity growth will be a relief for firms strapped for storage space across the supply chain, but the modest levels of growth being predicted make it likely that prices will remain high throughout 2024 (as will be seen below).
Warehousing Utilization
The November Warehousing Utilization index registered in at 52.9 reflecting a 14-point decrease from the reading one month ago, which is down approximately four points from the reading one year ago (56.8) and down over 15-points from the reading two years ago. The difference between Upstream (48.4) and Downstream (59.8) is notable, as utilization decreased Upstream but continued to grow at a healthy clip for Downstream retailers. Additionally, the split between small firms with <999 employees registered in at 50.9 whereas those firms with larger numbers of employees (greater than 1000) registered in at 62.0. Essentially, it is the large retailers who are driving Warehousing Utilization in November, something that is consistent with normal seasonal patterns at this time of the year.
Looking forward to the next 12 months, the predicted Warehousing Utilization index is 58.8, still growing but down considerably (-9.2) from October’s more optimistic future prediction of 68.0. Upstream firms are slightly more bullish on future utilization, predicting an expansionary rate of 59.5 relative to Downstream predictions of 57.7-point growth.
Warehousing Prices
The November Warehousing Price index registered at 64.2 reflecting a 6.5-point decrease from the reading one month ago, which is down over 10.0 points from the reading one year ago (74.4) and down a considerable 26-points from the reading two years ago when storage space was at an absolute premium. Price growth was consistent across all levels of the supply chain in November. The difference between Upstream (62.7) and Downstream (65.8) was not statistically significant. Additionally, the split between small firms with <999 employees registered in at 63.0 whereas those firms with larger numbers of employees (greater than 1000) registered in at 64.9, yet the difference was not statistically significant.
Future predictions suggest prices growth will remain healthy as respondents are expecting prices to continue to grow at a rate of 65.3, down (-3.7) from October’s future prediction of 69.0, suggesting that storage costs will continue growing, but possibly at a lower rate than what we’ve seen over the last year. Downstream firms expect a faster rate of price expansion at 69.7 relative to Upstream predictions of 62.1 – although in both cases respondents across the supply chain are still expecting a healthy year of growth in Warehousing Prices.
Transportation Capacity
The Transportation Capacity Index registered 61.8 percent in November 2023. This constitutes an increase of 5.1 points from the October reading of 56.7. The Upstream Transportation Capacity index is at 59.9, while the Downstream index is at 65.4. As such, the Transportation Capacity index moved higher to indicate further expansion and this increase in Transportation Capacity is prevalent across the supply chain.
The future Transportation Capacity index indicates 48.2 corresponding to a slight increase of 0.4 points from the previous reading, remaining below 50 and continuing to indicate expectations of slight contraction in Transportation Capacity over the next 12 months. The Downstream future Transportation Capacity index is at 43.8 while the Upstream future Transportation Capacity index indicates 50.7. So Upstream future expectations are slightly more positive than Downstream expectations, but this difference is not statistically significant.
Transportation Utilization
The Transportation Utilization Index registered 50.0 in November 2023. This corresponds to a large drop of 10.7 percentage points from last month’s reading. With this decrease, Transportation Utilization is back to where it was in August and indicates that Transportation Utilization is no longer increasing. The Downstream Transportation Utilization Index is now at 55.1, while the Upstream index is now at 47.9, indicating that the ramp up regarding the holiday season is likely over, especially upstream.
The future Transportation Utilization Index continues to drop slightly but still indicates expansion at a level of 62.3 for the next 12 months. The Upstream Transportation Utilization index is at 59.3 while the Downstream index is at 66.7. So, the expectations of slight continued growth in Transportation Utilization are relatives evenly distributed across the supply chain.
Transportation Prices
The Transportation Prices Index reads in at 44.2 in November 2023, which corresponds to a small decrease of 0.2 points from last month. Hence, this price index remains in slight contraction territory, but even so is the second-highest reading of 2023 in what is essentially a continuation from last month. It is interesting that Transportation Prices, which have been the lowest metric all year and are often the canary in the coalmine for the overall logistics industry is the metric that had the smallest drop during November’s swoon. The Downstream Transportation Prices index is now at 50.0, while the Upstream index is at 41.5, continuing to indicate contraction.
The future index for Transportation Prices drops 1.2 points from last month and is now at 63.8, continuing to indicate expectations of higher transportation prices in the next 12 months. The Downstream Transportation Prices index is at 63.8 while the Upstream Transportation Prices index is at 63.4, so expectations of higher Transportation Prices in the next 12 months are relatively uniformly distributed across the supply chain.
About This Report
The data presented herein are obtained from a survey of logistics supply executives based on information they have collected within their respective organizations. LMI® makes no representation, other than that stated within this release, regarding the individual company data collection procedures. The data should be compared to all other economic data sources when used in decision-making.
Data and Method of Presentation
Data for the Logistics Manager’s Index is collected in a monthly survey of leading logistics professionals. The respondents are CSCMP members working at the director-level or above. Upper-level managers are preferable as they are more likely to have macro-level information on trends in Inventory, Warehousing and Transportation trends within their firm. Data is also collected from subscribers to both DC Velocity and Supply Chain Quarterly as well. Respondents hail from firms working on all six continents, with the majority of them working at firms with annual revenues over a billion dollars. The industries represented in this respondent pool include, but are not limited to: Apparel, Automotive, Consumer Goods, Electronics, Food & Drug, Home Furnishings, Logistics, Shipping & Transportation, and Warehousing.
Respondents are asked to identify the monthly change across each of the eight metrics collected in this survey (Inventory Levels, Inventory Costs, Warehousing Capacity, Warehousing Utilization, Warehousing Prices, Transportation Capacity, Transportation Utilization, and Transportation Prices). In addition, they also forecast future trends for each metric ranging over the next 12 months. The raw data is then analyzed using a diffusion index. Diffusion Indexes measure how widely something is diffused or spread across a group. The Bureau of Labor Statistics has been using a diffusion index for the Current Employment Statics program since 1974, and the Institute for Supply Management (ISM) has been using a diffusion index to compute the Purchasing Managers Index since 1948. The ISM Index of New Orders is considered a Leading Economic Indicator.
We compute the Diffusion Index as follows:
PD = Percentage of respondents saying the category is Declining,
PU = Percentage of respondents saying the category is Unchanged,
PI = Percentage of respondents saying the category is Increasing,
Diffusion Index = 0.0 * PD + 0.5 * PU + 1.0 * PI
For example, if 25 say the category is declining, 38 say it is unchanged, and 37 say it is increasing, we would calculate an index value of 0*0.25 + 0.5*0.38 + 1.0*0.37 = 0 + 0.19 + 0.37 = 0.56, and the index is increasing overall. For an index value above 0.5 indicates the category is increasing, a value below 0.5 indicates it is decreasing, and a value of 0.5 means the category is unchanged. When a full year’s worth of data has been collected, adjustments will be made for seasonal factors as well.
Logistics Managers Index
Requests for permission to reproduce or distribute Logistics Managers Index Content can be made by contacting in writing at: Dale S. Rogers, WP Carey School of Business, Tempe, Arizona 85287, or by emailing [email protected] Subject: Content Request.
The authors of the Logistics Managers Index shall not have any liability, duty, or obligation for or relating to the Logistics Managers Index Content or other information contained herein, any errors, inaccuracies, omissions, or delays in providing any Logistics Managers Index Content, or for any actions taken in reliance thereon. In no event shall the authors of the Logistics Managers Index be liable for any special, incidental, or consequential damages, arising out of the use of the Logistics Managers Index. Logistics Managers Index, and LMI® are registered trademarks.
About The Logistics Manager’s Index®
The Logistics Manager’s Index (LMI) is a joint project between researchers from Arizona State University, Colorado State University, University of Nevada, Reno, Florida Atlantic University, and Rutgers University, supported by CSCMP. It is authored by Zac Rogers Ph.D., Steven Carnovale Ph.D., Shen Yeniyurt Ph.D., Ron Lembke Ph.D., and Dale Rogers Ph.D.
[1] Walk-Morris, T. (2023b, December 1). Thanksgiving holiday weekend sees ‘record number’ of shoppers: NRF. Retail Dive. https://www.retaildive.com/news/thanksgiving-holiday-record-shoppers-nrf-black-friday/701256/
[2] Kohan, S. E. (2023, November 30). Black Friday And Cyber Monday Record Sales: By The Numbers. Forbes. https://www.forbes.com/sites/shelleykohan/2023/11/30/black-friday-and-cyber-monday-record-sales-by-the-numbers/
[3] Walk-Morris, T. (2023a, November 29). Cyber Monday shoppers spent $12.4B online: Adobe. Retail Dive. https://www.retaildive.com/news/cyber-monday-online-sales-rise-digital-spending/700962/
[4] Kapner, S., & Moise, I. (2023, November 26). Black Friday Spending Was Strong. How People Pay for Gifts Is Upending Retailers. WSJ. https://www.wsj.com/business/retail/black-friday-spending-was-strong-how-people-pay-for-gifts-is-upending-retailers-e783ba2e
[5] Guilford, G. (2023, November 30). Consumers Pulled Back on Spending, Inflation Eased in October. WSJ. https://www.wsj.com/economy/consumers/inflation-consumer-spending-personal-income-october-2023-6a1ecb1d
[6] Shapiro, A. (2023, December 1). Supply- and Demand-Driven PCE Inflation—October 2023. San Francisco Fed. https://www.frbsf.org/economic-research/indicators-data/supply-and-demand-driven-pce-inflation/
[7] Timiraos, N. (2023, December 1). Fed’s Interest Rate Hikes Are Probably Over, but Officials Are Reluctant to Say So. WSJ. https://www.wsj.com/economy/central-banking/fed-interest-rate-hikes-b19c2ab2
[8] Wallace, J., & Banerji, G. (2023, December 1). Stock Market News, Dec. 1, 2023: Dow Finishes Above 36000, Indexes Post Weekly Gains. WSJ. https://www.wsj.com/livecoverage/stock-market-today-dow-jones-12-01-2023
[9] Phillips, M. (2023a, November 21). RIP earnings recession. Axios. https://www.axios.com/2023/11/21/earnings-recession-sp500-stocks
[10] Phillips, M. (2023b, November 30). Chart: Corporate profits popped in Q3. Axios. https://www.axios.com/2023/11/30/corporate-profits-q3-2024
[11] Mandavia, M. (2023, December 1). The World’s Key Canal Is Clogged Up. Winter Fuel Prices Could Get Wacky. WSJ. https://www.wsj.com/finance/commodities-futures/the-worlds-key-canal-is-clogged-up-winter-fuel-prices-could-get-wacky-3a35e15d
[12] Douglas, J. (2023, November 30). China’s Economy Faces a Sour End to the Year. WSJ. https://www.wsj.com/world/china/chinas-manufacturing-pmi-edged-lower-signaling-continued-weakness-924c15a8
[13] Agarwal, V. (2023, November 30). India Remains a Bright Spot in Global Economy. WSJ. https://www.wsj.com/economy/global/india-remains-a-bright-spot-in-global-economy-79661726
[14] Strickland, Z. (2023, December 3). Atlanta becomes casualty of imports returning to West Coast. FreightWaves. https://www.freightwaves.com/news/atlanta-becomes-casualty-of-imports-returning-to-west-coast
[15] Young, L. (2023c, November 14). Walgreens Wants the Corner Drugstore to Be an Online Delivery Hub. Wall Street Journal. https://www.wsj.com/articles/walgreens-wants-the-corner-drugstore-to-be-an-online-delivery-hub-6936cbd7
[16] Young, L. (2023d, November 27). Retailers Have Cleaned Up Their Inventories for the Holidays. Wall Street Journal. https://www.wsj.com/articles/retailers-have-cleaned-up-their-inventories-for-the-holidays-1c6e7e51
[17] Garland, M. (2023, November 27). Walmart adding parcel stations for faster delivery, greater density. Retail Dive. https://www.retaildive.com/news/walmart-parcel-stations-stores-last-mile-delivery/700616/
[18] Young, L. (2023b, November 7). TikTok Is Bringing Logistics to the E-Commerce Dance. Wall Street Journal. https://www.wsj.com/articles/tiktok-brings-logistics-to-the-e-commerce-dance-b43d884d
[19] Young, L. (2023a, October 26). Those New Online Returns Fees Are Driving Away Shoppers. Wall Street Journal. https://www.wsj.com/articles/those-new-online-returns-fees-are-driving-away-shoppers-2d3aa5fb
[20] Mattioli, D., & Fung, E. (2023, November 27). WSJ News Exclusive | The Biggest Delivery Business in the U.S. Is No Longer UPS or FedEx. WSJ. https://www.wsj.com/business/amazon-vans-outnumber-ups-fedex-750f3c04
[21] Jacob, D. (2023, October 25). UPS To Buy Reverse Logistics Specialist Happy Returns from PayPal. Wall Street Journal. https://www.wsj.com/articles/ups-to-buy-reverse-logistics-specialist-happy-returns-from-paypal-9a3ac420
[22] Young, L. (2023a, October 26). Those New Online Returns Fees Are Driving Away Shoppers. Wall Street Journal. https://www.wsj.com/articles/those-new-online-returns-fees-are-driving-away-shoppers-2d3aa5fb

