FOR RELEASE: Tuesday, May 2nd, 2023
Contact:
Zac Rogers, Ph.D.
Logistics Manager’s Index Analyst
Assistant Professor, Supply Chain Management
Department of Management
Colorado State University
Fort Collins, Colorado
(970) 491-0890
E-mail: Zac.Rogers@colostate.edu
http://www.logisticsindex.org
Twitter: @LogisticsIndex
Contact:
Zac Rogers, Ph.D.
Logistics Manager’s Index Analyst
Assistant Professor, Supply Chain Management
Department of Management
Colorado State University
Fort Collins, Colorado
(970) 491-0890
E-mail: Zac.Rogers@colostate.edu
http://www.logisticsindex.org
Twitter: @LogisticsIndex
April 2023 Logistics Manager’s Index Report®
LMI® at 50.9
Growth is INCREASING AT AN INCREASING RATE for: Transportation Utilization
Growth is INCREASING AT AN DECREASING RATE for: Inventory Levels, Inventory Costs, Warehousing Capacity, Warehousing Utilization, Warehousing Prices, and Transportation Capacity
Transportation Prices ARE DECREASING
(Fort Collins, Colorado) — For the second consecutive month the Logistics Managers’ Index has reached a new all-time low, reading in at 50.9 in April. While this is only slightly down (-0.2) from March’s reading of 51.1, it marks a new nadir in the 6.5-year history of the index. This new low is being driven by a dip in Inventory Levels, which are down (-4.7) to 50.9, suggesting that respondents continue to get closer to properly balancing their supply of goods and working through the glut many of them have been saddled with for the last year. The drop in inventories has led to a significant (-9.9) drop in Warehousing Utilization which in turn has dropped Warehousing Prices – particularly for Downstream firms – as the metric reads in below 70.0 for the first time since August of 2020. This comes on the heels of Inventory Costs dipping below 70.0 for the first time in over two years in March, demonstrating the somewhat lagged nature of Warehousing Costs.
Interestingly, the three transportation metrics showed signs of getting a bit busier. Transportation Utilization moved back up (+5.0) into expansion territory at 55.0 after reading in at “no movement’ last month. Transportation Prices are still contracting, but at a lessened pace (+5.7), reading in at 36.8 which is up from last month’s all-time low of 31.1. A potential explanation for this would be that as inventories continue to dip in consumer goods and retail industries (they are more stagnant Upstream for B2B goods and things like furniture or appliances that are tied to the housing market), warehousing capacity is finally loosening up, and firms are utilizing slightly more of the available transportation capacity to replenish those goods. Unfortunately for carriers, there are no signs of recovery yet Upstream, meaning that those that rely on moving larger, bulkier goods are still seeing large parts of their fleets sit idle. The freight recession continues, even as several other sectors of the economy demonstrate resilience.
Researchers at Arizona State University, Colorado State University, Florida Atlantic University, Rutgers University, and the University of Nevada, Reno, and in conjunction with the Council of Supply Chain Management Professionals (CSCMP) issued this report today.
Results Overview
The LMI score is a combination of eight unique components that make up the logistics industry, including: inventory levels and costs, warehousing capacity, utilization, and prices, and transportation capacity, utilization, and prices. The LMI is calculated using a diffusion index, in which any reading above 50.0 indicates that logistics is expanding; a reading below 50.0 is indicative of a shrinking logistics industry. The latest results of the LMI summarize the responses of supply chain professionals collected in April 2023.
As has been the case for the last year, the overall economy continues to be somewhat mixed. UPS, JB Hunt, and Knight-Swift all missed on earnings in the first quarter. JB Hunt president Shelley Simpson admitted to analysts in a recent earnings call that we are currently in a freight recession (something that was called out in LMI reports from earlier this year), this is a far cry from the optimism many carriers were espousing back in January[1]. Despite the gloomy outlook in the trucking industry, it should be pointed out that the U.S. misery index – which is the combined sum of inflation and unemployment rates, was down to 8.48 in March, the lowest in two years[2]. Despite the Fed’s program of interest rates – combined with the continued decline in aggregate supply costs – have slowing inflation, unemployment rates remain very positive. The Dow Jones industrial average rose 2.5% in April, which is the best month since January’s increase of 2.8%. Much of this growth was driven by more consumer-focused stocks which continue to thrive even as some tech companies falter[3]. It is also worth pointing out that European and U.S. business activity increased in April at the fastest pace in nearly a year. This was largely driven by services, which were in turn facilitated by lower spending on power amid a milder-than-expected winter[4]. Consumer spending was up to 3.7% in Q1 – a massive jump from the 1% growth observed in Q4[5]. Headline inflation in March was up a relatively mild 3.7% as gas prices continue to fall[6]. While this is well below the price spikes seen last year, this growth makes it more likely that the Fed will raise interest rates by another quarter point at their meeting in early May, bringing rates to an even 5.0%.
Despite the many pieces of positive economic news, the overall LMI index is down (-0.2) to 50.9 and its lowest reading in the history of the index. Like 2019, it seems that we simultaneously have a recession in the freight industry, but not in the overall economy. Consumer spending on things like services remains high, but bulky goods are not being shipped B2B and trucking capacity is sitting idle. In 2018-2019 the Upstream slowdown was caused largely by the trade war between the US and China, in 2022-2023 it is due to the interaction of inflation and the excess inventories that were built up in 2021. It can be confusing to observe continued positive news for things like spending and unemployment, while at the same time seeing small truck fleets shutting down.
The overall economy is not separate from the logistics industry. The opposite is true, as they inform each other. Evidence of this connectivity can be seen in recent GDP reporting. U.S. GDP read in at 1.1% growth in Q1. This was down from the 2.6% expansion in Q4 and lower than analysts had expected. Like what we saw in Q2 of 2022, the largest downward pull came from the reduction of inventories, which took 2.26 percentage points off of expansion[7]. This is consistent with the downward trend that we have observed with inventories throughout 2023. Inventory Levels are down 11.5-points since January (and down 4.7-points from March) to 50.9 which is right on the verge of contraction. Inventory Levels actively contracted in the second half of April (at a rate of 42.6 relative to the 63.3-point expansion in the first half of April) if this trend continues and we see contraction in May, it would be the first time since February 2020 that inventories have not increased. This drop led to a mild slowdown (-0.9) in the expansion rate of Inventory Costs, which read in at 66.0. Inventories are moving quickly for consumables, but more slowly for more expensive goods. March retail sales were down in the U.S., particularly for large items like autos, appliances, and furniture that require financing. The decrease in spending on big-ticket items was a contributing factor to the 0.5% month-over-month decline in manufacturing output over the same period. At the same time, consumers have been willing to absorb higher prices for restaurants, groceries, and home necessities such as diapers and soap[8] and spending on services such as dining at restaurants and bars is up by double digits year-over-year[9]. Consumables have been positive as well, Amazon’s Q1 sales were up 9% y-o-y to $127.4 billion. In a reverse of recent trends, shipments to consumers are their primary driver of growth as AWS revenues are down[10]. When taken together, it is clear that the overall economy continues to be powered by Downstream activity, and that the complications of the bullwhip that started in 2022 continue to echo through the first few months of 2023.
While Americans spending money is good news for the overall economy, it is less helpful for the freight market that thrives on the transportation of goods. Fleets continue to idle as Transportation Capacity (-0.8) reads in at 70.6 and is now the only one of our metrics coming in over 70.0 which we classify as a significant rate of expansion (although it expanded significantly more slowly in the second half of April at a rate of 64.5). The slowness in transportation can be observed in UPS forecasting a decline in annual revenues for the first time since the recession of 2009. This is largely driven by consumers shifting spending to services and away from goods. According to CEO Carol Tomé, the pullback in volume was particularly biting in March (the same month in which our Transportation Prices index hit its all-time low)[11]. An additional source of pain for UPS has been the threat of a potential strike. The 330,000 UPS employees represented by the Teamster’s Union will see their contracts expire this Summer. Analysts believe that the uncertainty surrounding UPS’s labor situation could lead to 10% of UPS’s volume flowing to other competitors – including FedEx which has started a campaign specifically aimed at UPS customers who may be impacted by a slowdown[12] [13]. C.H. Robinson reported truckload volume being down by 3.5% year-over-year leading to a 21.9% decrease in gross profit. Robinson also reported stronger performance in LTL relative to truckload activities[14], giving more credence to the trend of larger bulk goods staying slow through the first quarter of 2023. Evidence of the lessened volume coming through the West Coast Ports can be seen in the per-mile trip from the Inland Empire to Chicago being lower than the reverse. This implies that there is more volume moving east to west than west to east – reflecting lower inventory traffic[15]. Part of the reason behind this drop is the drop in inbound container imports to somewhere near 2019 levels[16].
It is not all bad news for transportation. Transportation Utilization, which was (+5.0) to 55.0 from March’s reading of “no movement”. This increase comes largely from Downstream respondents (59.5), but there was a slight increase Upstream as well (51.4). In last month’s report we wondered whether utilization would slide back into the contraction territory we observed in December (which was its only negative reading in the last two years). This did not take place as in April’s report it ticked back up. Whether this pattern will continue or not remains to be seen. Transportation Prices read in at 36.8, contracting for the tenth consecutive month but at a lessened rate (+5.7) than the all-time low of 31.1 observed in March. This comes as diesel costs continue to drop, down $1.08 per gallon year-over-year[17].
Whether or not we have hit bottom on rates is unclear. The spread between the spot and contract market reached $0.92 per mile in the last week of April[18]. As more contracts expire, we may see this spread decline as cheaper contracts are signed. As an example, spot prices from Asia to the West Coast of the U.S. were up to nearly $1,700 at the end of April[19]. This is still below “normal” rates but is significantly higher than the triple-digit prices that have reigned through most of the year. If rates continue to pick up we should expect more contracts to be signed as shippers attempt to lock in low prices before any potential increases that may come with peak season.
Despite adding 236,000 jobs in March, warehousing and storage employment decreased by 12,000[20] as Warehousing metrics continued to slow down after their sky-high run throughout 2021 and 2022. Warehousing Capacity expanded for the third consecutive month at a rate of 54.7, which was down (-3.5) from March’s reading of 58.2. Warehousing Utilization had the biggest change of any metric in this month’s report, dropping 9.9 points to 55.1. Utilization dipped significantly in the second half of April, moving from expansion of 61.1 in the first half of the month to 50.0 and no movement at all in the second half. This metric has been volatile as of late. This was the fourth month-over-month shift of 8.0 points or higher since August of last year. Despite this volatility, Warehousing Prices are down (-1.1) to 69.8 – the first reading below 70.0 since August of 2020. High storage costs have been a thorn in the side of supply chains and consumers for nearly three years, this move back to a more sustainable rate of growth will be a cause of concern to some readers of this report, but a relief to many of the others. With the stabilization of ecommerce and the move towards more spending on services some reports are finding that ecommerce customers may not be as dead-set on next- and same-day delivery as they had been during the height of COVID lockdown[21].
As has been mentioned several times in previous reports, the conditions in the freight market and overall economy are very similar to what we saw in 2019 when we had a freight recession due to slowness Upstream, but the overall economy was kept out of a recession by Downstream consumer spending. COVID was the thing that finally broke the freight market out of this cycle due to the pressure it put on increased spending on goods, allowing carriers to utilize the excess capacity they had built up in the preceding years. Ideally a global pandemic will not be necessary to end this ongoing freight recession. Freight recessions end when there is either balance between supply and demand or if demand eventually starts to outstrip supply. The current abundance of supply is due to the large fleets that were built up (and are still being built up) combined with inflation and the shift back towards services pushing down freight volume. Slowness in the housing market driven by high interest rates has brought the shipment of bulky products like appliances and furniture to a standstill. When the Fed finally pauses its program of interest increases and rates can stabilize, volume will flow back into the market. The issue is that no one, not even the Fed, is sure when this will happen. Until then, there is simply too much unpredictability for firms and consumers alike to have the confidence required to make the big-ticket purchases that will drive volumes and rebalance the freight market.
Ideally a shift back towards growth will happen in a measured way, and not all at once like it did during COVID. This will allow carriers and 3PLs to be more strategic about right-sizing their capacity, helping them to avoid another bullwhip effect and blunt the effects of a future drop in demand. The freight market has always been cyclical, and the “ups” are often equivalent in size to the “downs”. In 2020-2021 we saw a big “up”, and in 2022 to early 2023 we’re moving through a big “down”. If the next upcycle can be a bit more moderate, then perhaps the next downcycle will be the same.
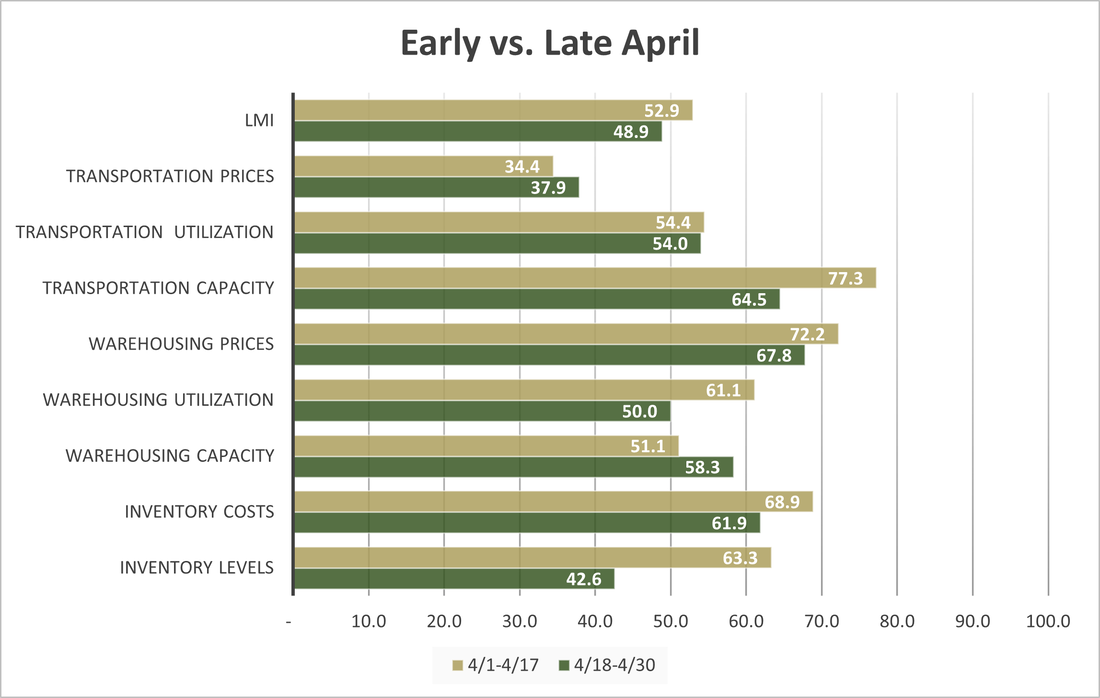
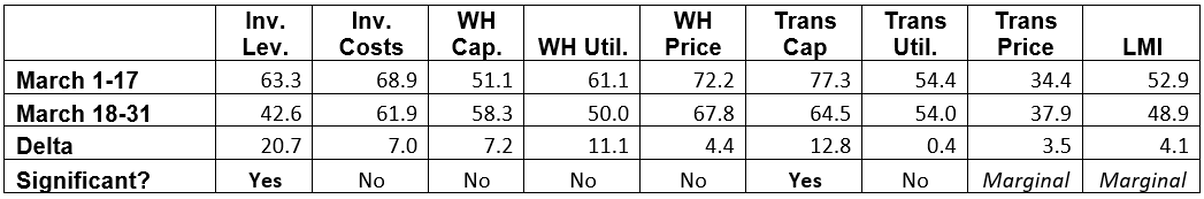
Much like what we observed in March, respondent attitudes varied between the first (4/1-4/17) and second half (4/18-4/30) of the month. Unlike March, readings tended to decline in the second half of the month (whereas last month things got busier). There is nuance to this shift. The most pronounced change was in Inventory Levels, which dropped an astonishing 20.7-points, moving from a reading of robust growth at 63.3 in the first half of April to contracting at 42.6 in the back half of the month. This dip led to a marginally significant decrease in the overall LMI, which moved from 52.9 to 48.9 – and active contraction in the second part of April. Interestingly, we saw the rate of Transportation Capacity growth down significantly (down 12.8 points from 77.3 to 64.5) and the rate of Transportation Price contraction slow down at a marginally significant rate (up 3.5 points from 34.4 to 37.9). Clearly some firms are continuing to wind down inventories. It also seems as though they are utilizing more transportation services to do so. Stagnant inventories have overloaded warehouses and left trucking fleets with nothing to do over the last year. If inventories continue to wind down – not just Downstream as they have been but Upstream as well – we could see the logistics industry shake itself out of some of its current doldrums
Interestingly, the three transportation metrics showed signs of getting a bit busier. Transportation Utilization moved back up (+5.0) into expansion territory at 55.0 after reading in at “no movement’ last month. Transportation Prices are still contracting, but at a lessened pace (+5.7), reading in at 36.8 which is up from last month’s all-time low of 31.1. A potential explanation for this would be that as inventories continue to dip in consumer goods and retail industries (they are more stagnant Upstream for B2B goods and things like furniture or appliances that are tied to the housing market), warehousing capacity is finally loosening up, and firms are utilizing slightly more of the available transportation capacity to replenish those goods. Unfortunately for carriers, there are no signs of recovery yet Upstream, meaning that those that rely on moving larger, bulkier goods are still seeing large parts of their fleets sit idle. The freight recession continues, even as several other sectors of the economy demonstrate resilience.
Researchers at Arizona State University, Colorado State University, Florida Atlantic University, Rutgers University, and the University of Nevada, Reno, and in conjunction with the Council of Supply Chain Management Professionals (CSCMP) issued this report today.
Results Overview
The LMI score is a combination of eight unique components that make up the logistics industry, including: inventory levels and costs, warehousing capacity, utilization, and prices, and transportation capacity, utilization, and prices. The LMI is calculated using a diffusion index, in which any reading above 50.0 indicates that logistics is expanding; a reading below 50.0 is indicative of a shrinking logistics industry. The latest results of the LMI summarize the responses of supply chain professionals collected in April 2023.
As has been the case for the last year, the overall economy continues to be somewhat mixed. UPS, JB Hunt, and Knight-Swift all missed on earnings in the first quarter. JB Hunt president Shelley Simpson admitted to analysts in a recent earnings call that we are currently in a freight recession (something that was called out in LMI reports from earlier this year), this is a far cry from the optimism many carriers were espousing back in January[1]. Despite the gloomy outlook in the trucking industry, it should be pointed out that the U.S. misery index – which is the combined sum of inflation and unemployment rates, was down to 8.48 in March, the lowest in two years[2]. Despite the Fed’s program of interest rates – combined with the continued decline in aggregate supply costs – have slowing inflation, unemployment rates remain very positive. The Dow Jones industrial average rose 2.5% in April, which is the best month since January’s increase of 2.8%. Much of this growth was driven by more consumer-focused stocks which continue to thrive even as some tech companies falter[3]. It is also worth pointing out that European and U.S. business activity increased in April at the fastest pace in nearly a year. This was largely driven by services, which were in turn facilitated by lower spending on power amid a milder-than-expected winter[4]. Consumer spending was up to 3.7% in Q1 – a massive jump from the 1% growth observed in Q4[5]. Headline inflation in March was up a relatively mild 3.7% as gas prices continue to fall[6]. While this is well below the price spikes seen last year, this growth makes it more likely that the Fed will raise interest rates by another quarter point at their meeting in early May, bringing rates to an even 5.0%.
Despite the many pieces of positive economic news, the overall LMI index is down (-0.2) to 50.9 and its lowest reading in the history of the index. Like 2019, it seems that we simultaneously have a recession in the freight industry, but not in the overall economy. Consumer spending on things like services remains high, but bulky goods are not being shipped B2B and trucking capacity is sitting idle. In 2018-2019 the Upstream slowdown was caused largely by the trade war between the US and China, in 2022-2023 it is due to the interaction of inflation and the excess inventories that were built up in 2021. It can be confusing to observe continued positive news for things like spending and unemployment, while at the same time seeing small truck fleets shutting down.
The overall economy is not separate from the logistics industry. The opposite is true, as they inform each other. Evidence of this connectivity can be seen in recent GDP reporting. U.S. GDP read in at 1.1% growth in Q1. This was down from the 2.6% expansion in Q4 and lower than analysts had expected. Like what we saw in Q2 of 2022, the largest downward pull came from the reduction of inventories, which took 2.26 percentage points off of expansion[7]. This is consistent with the downward trend that we have observed with inventories throughout 2023. Inventory Levels are down 11.5-points since January (and down 4.7-points from March) to 50.9 which is right on the verge of contraction. Inventory Levels actively contracted in the second half of April (at a rate of 42.6 relative to the 63.3-point expansion in the first half of April) if this trend continues and we see contraction in May, it would be the first time since February 2020 that inventories have not increased. This drop led to a mild slowdown (-0.9) in the expansion rate of Inventory Costs, which read in at 66.0. Inventories are moving quickly for consumables, but more slowly for more expensive goods. March retail sales were down in the U.S., particularly for large items like autos, appliances, and furniture that require financing. The decrease in spending on big-ticket items was a contributing factor to the 0.5% month-over-month decline in manufacturing output over the same period. At the same time, consumers have been willing to absorb higher prices for restaurants, groceries, and home necessities such as diapers and soap[8] and spending on services such as dining at restaurants and bars is up by double digits year-over-year[9]. Consumables have been positive as well, Amazon’s Q1 sales were up 9% y-o-y to $127.4 billion. In a reverse of recent trends, shipments to consumers are their primary driver of growth as AWS revenues are down[10]. When taken together, it is clear that the overall economy continues to be powered by Downstream activity, and that the complications of the bullwhip that started in 2022 continue to echo through the first few months of 2023.
While Americans spending money is good news for the overall economy, it is less helpful for the freight market that thrives on the transportation of goods. Fleets continue to idle as Transportation Capacity (-0.8) reads in at 70.6 and is now the only one of our metrics coming in over 70.0 which we classify as a significant rate of expansion (although it expanded significantly more slowly in the second half of April at a rate of 64.5). The slowness in transportation can be observed in UPS forecasting a decline in annual revenues for the first time since the recession of 2009. This is largely driven by consumers shifting spending to services and away from goods. According to CEO Carol Tomé, the pullback in volume was particularly biting in March (the same month in which our Transportation Prices index hit its all-time low)[11]. An additional source of pain for UPS has been the threat of a potential strike. The 330,000 UPS employees represented by the Teamster’s Union will see their contracts expire this Summer. Analysts believe that the uncertainty surrounding UPS’s labor situation could lead to 10% of UPS’s volume flowing to other competitors – including FedEx which has started a campaign specifically aimed at UPS customers who may be impacted by a slowdown[12] [13]. C.H. Robinson reported truckload volume being down by 3.5% year-over-year leading to a 21.9% decrease in gross profit. Robinson also reported stronger performance in LTL relative to truckload activities[14], giving more credence to the trend of larger bulk goods staying slow through the first quarter of 2023. Evidence of the lessened volume coming through the West Coast Ports can be seen in the per-mile trip from the Inland Empire to Chicago being lower than the reverse. This implies that there is more volume moving east to west than west to east – reflecting lower inventory traffic[15]. Part of the reason behind this drop is the drop in inbound container imports to somewhere near 2019 levels[16].
It is not all bad news for transportation. Transportation Utilization, which was (+5.0) to 55.0 from March’s reading of “no movement”. This increase comes largely from Downstream respondents (59.5), but there was a slight increase Upstream as well (51.4). In last month’s report we wondered whether utilization would slide back into the contraction territory we observed in December (which was its only negative reading in the last two years). This did not take place as in April’s report it ticked back up. Whether this pattern will continue or not remains to be seen. Transportation Prices read in at 36.8, contracting for the tenth consecutive month but at a lessened rate (+5.7) than the all-time low of 31.1 observed in March. This comes as diesel costs continue to drop, down $1.08 per gallon year-over-year[17].
Whether or not we have hit bottom on rates is unclear. The spread between the spot and contract market reached $0.92 per mile in the last week of April[18]. As more contracts expire, we may see this spread decline as cheaper contracts are signed. As an example, spot prices from Asia to the West Coast of the U.S. were up to nearly $1,700 at the end of April[19]. This is still below “normal” rates but is significantly higher than the triple-digit prices that have reigned through most of the year. If rates continue to pick up we should expect more contracts to be signed as shippers attempt to lock in low prices before any potential increases that may come with peak season.
Despite adding 236,000 jobs in March, warehousing and storage employment decreased by 12,000[20] as Warehousing metrics continued to slow down after their sky-high run throughout 2021 and 2022. Warehousing Capacity expanded for the third consecutive month at a rate of 54.7, which was down (-3.5) from March’s reading of 58.2. Warehousing Utilization had the biggest change of any metric in this month’s report, dropping 9.9 points to 55.1. Utilization dipped significantly in the second half of April, moving from expansion of 61.1 in the first half of the month to 50.0 and no movement at all in the second half. This metric has been volatile as of late. This was the fourth month-over-month shift of 8.0 points or higher since August of last year. Despite this volatility, Warehousing Prices are down (-1.1) to 69.8 – the first reading below 70.0 since August of 2020. High storage costs have been a thorn in the side of supply chains and consumers for nearly three years, this move back to a more sustainable rate of growth will be a cause of concern to some readers of this report, but a relief to many of the others. With the stabilization of ecommerce and the move towards more spending on services some reports are finding that ecommerce customers may not be as dead-set on next- and same-day delivery as they had been during the height of COVID lockdown[21].
As has been mentioned several times in previous reports, the conditions in the freight market and overall economy are very similar to what we saw in 2019 when we had a freight recession due to slowness Upstream, but the overall economy was kept out of a recession by Downstream consumer spending. COVID was the thing that finally broke the freight market out of this cycle due to the pressure it put on increased spending on goods, allowing carriers to utilize the excess capacity they had built up in the preceding years. Ideally a global pandemic will not be necessary to end this ongoing freight recession. Freight recessions end when there is either balance between supply and demand or if demand eventually starts to outstrip supply. The current abundance of supply is due to the large fleets that were built up (and are still being built up) combined with inflation and the shift back towards services pushing down freight volume. Slowness in the housing market driven by high interest rates has brought the shipment of bulky products like appliances and furniture to a standstill. When the Fed finally pauses its program of interest increases and rates can stabilize, volume will flow back into the market. The issue is that no one, not even the Fed, is sure when this will happen. Until then, there is simply too much unpredictability for firms and consumers alike to have the confidence required to make the big-ticket purchases that will drive volumes and rebalance the freight market.
Ideally a shift back towards growth will happen in a measured way, and not all at once like it did during COVID. This will allow carriers and 3PLs to be more strategic about right-sizing their capacity, helping them to avoid another bullwhip effect and blunt the effects of a future drop in demand. The freight market has always been cyclical, and the “ups” are often equivalent in size to the “downs”. In 2020-2021 we saw a big “up”, and in 2022 to early 2023 we’re moving through a big “down”. If the next upcycle can be a bit more moderate, then perhaps the next downcycle will be the same.
Much like what we observed in March, respondent attitudes varied between the first (4/1-4/17) and second half (4/18-4/30) of the month. Unlike March, readings tended to decline in the second half of the month (whereas last month things got busier). There is nuance to this shift. The most pronounced change was in Inventory Levels, which dropped an astonishing 20.7-points, moving from a reading of robust growth at 63.3 in the first half of April to contracting at 42.6 in the back half of the month. This dip led to a marginally significant decrease in the overall LMI, which moved from 52.9 to 48.9 – and active contraction in the second part of April. Interestingly, we saw the rate of Transportation Capacity growth down significantly (down 12.8 points from 77.3 to 64.5) and the rate of Transportation Price contraction slow down at a marginally significant rate (up 3.5 points from 34.4 to 37.9). Clearly some firms are continuing to wind down inventories. It also seems as though they are utilizing more transportation services to do so. Stagnant inventories have overloaded warehouses and left trucking fleets with nothing to do over the last year. If inventories continue to wind down – not just Downstream as they have been but Upstream as well – we could see the logistics industry shake itself out of some of its current doldrums
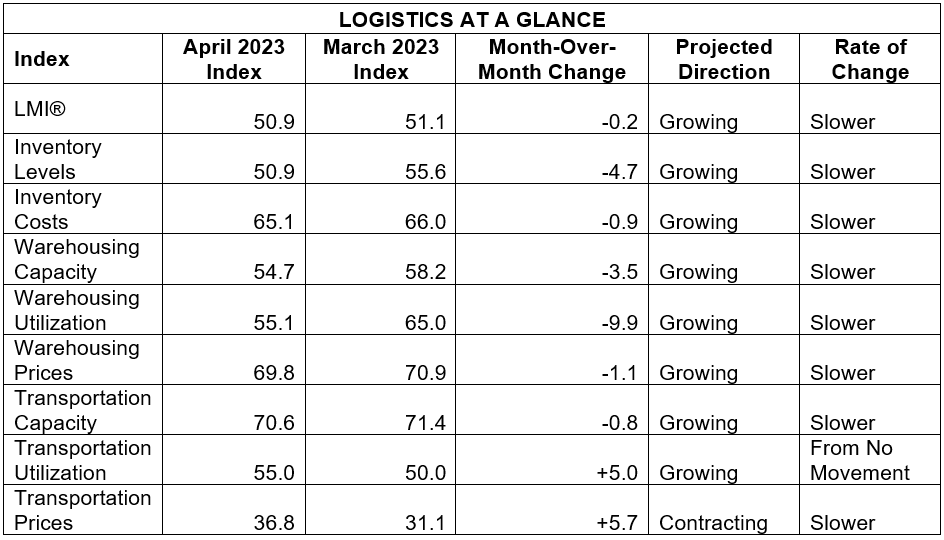
The index scores for each of the eight components of the Logistics Managers’ Index, as well as the overall index score, are presented in the table below. The only metric that is contracting is Transportation Prices, which are down for the tenth consecutive month but up from last month’s all-time low. Transportation Utilization has moved from no movement back to expansion. The remainder of the components are all expanding but at a decreasing rate.
The index scores for each of the eight components of the Logistics Managers’ Index, as well as the overall index score, are presented in the table below. The only metric that is contracting is Transportation Prices, which are down for the tenth consecutive month but up from last month’s all-time low. Transportation Utilization has moved from no movement back to expansion. The remainder of the components are all expanding but at a decreasing rate.
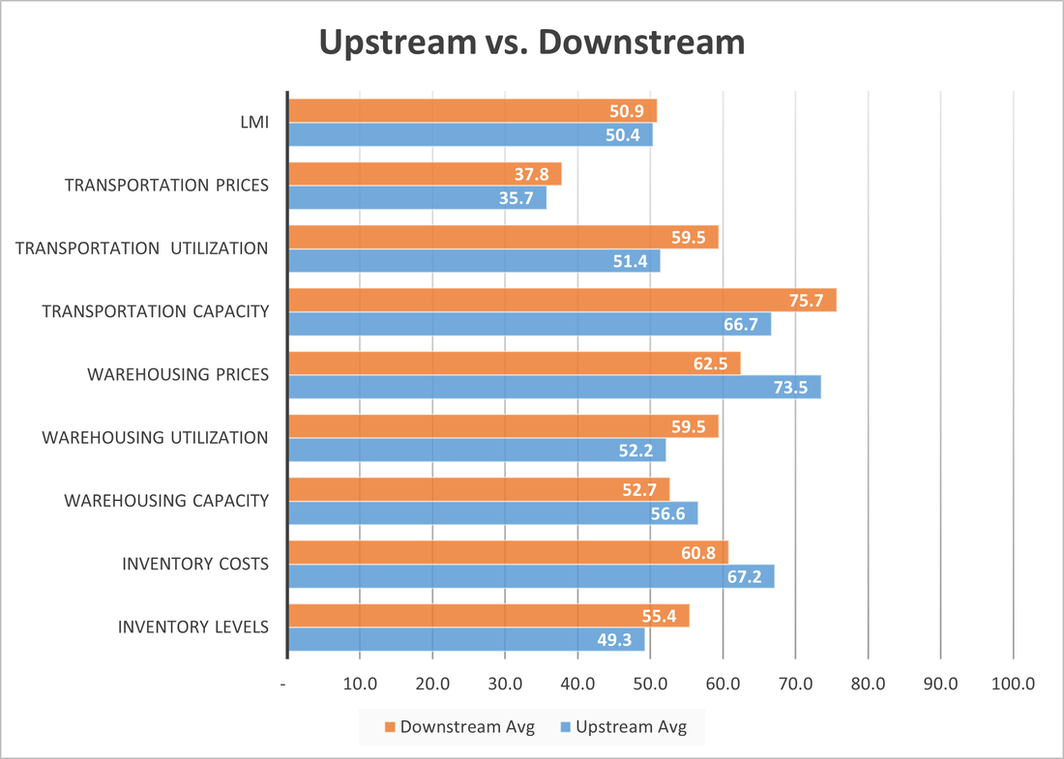
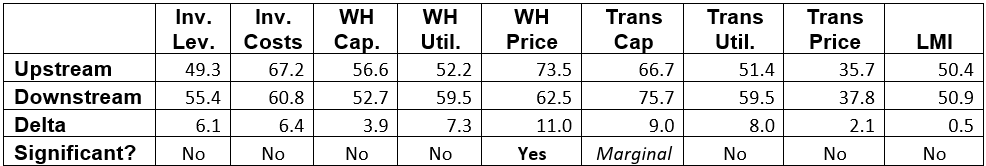
While there is very little difference in the overall index, we do see some contrasts in April between our Downstream (orange bars) and Upstream (blue bars) respondents. Downstream respondents report dealing with significantly lower Warehousing Prices (62.5 to 73.5) and marginally more available Transportation Capacity (75.7 to 66.7). These differences are likely a product of Downstream firms being able to unload their inventory more quickly and not being tied to expensive long-term warehousing contracts. While it is not statistically significant, we also see that Downstream respondents continue to expand Inventory Levels at a healthy rate (55.4) while Upstream firms attempt to reduce the volume of goods they’re carrying (49.3). When taken together, it would seem that Downstream firms are enjoying a greater rate of volume with their inventory, so they need to continually replenish stocks and keep stagnant inventories taking up room in expensive warehouses lower.
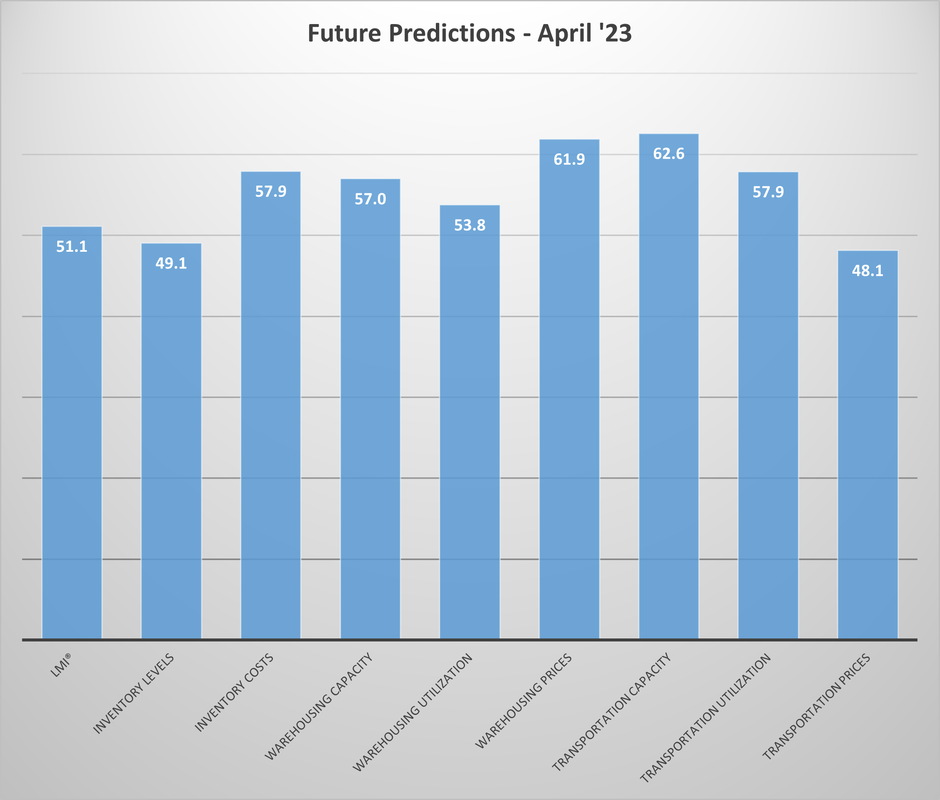
Respondents were asked to predict movement in the overall LMI and individual metrics 12 months from now. The future predictions for April continue the recent trend of respondents predicting relatively muted levels of growth across the logistics industry. Respondents are anticipating that Inventory Levels will continue to come down over the next year, moderating Inventory Costs and Warehousing Prices. They are not optimistic about Transportation Prices expanding, but the reading of 48.1 does suggest that respondents are at least expecting transportation markets to stabilize somewhat, something which would be welcome news for carriers. As mentioned above, the freight market seems likely to remain depressed until the program of interest rates slow down and more confident spending leads to volumes being flowing more freely.
Respondents were asked to predict movement in the overall LMI and individual metrics 12 months from now. The future predictions for April continue the recent trend of respondents predicting relatively muted levels of growth across the logistics industry. Respondents are anticipating that Inventory Levels will continue to come down over the next year, moderating Inventory Costs and Warehousing Prices. They are not optimistic about Transportation Prices expanding, but the reading of 48.1 does suggest that respondents are at least expecting transportation markets to stabilize somewhat, something which would be welcome news for carriers. As mentioned above, the freight market seems likely to remain depressed until the program of interest rates slow down and more confident spending leads to volumes being flowing more freely.
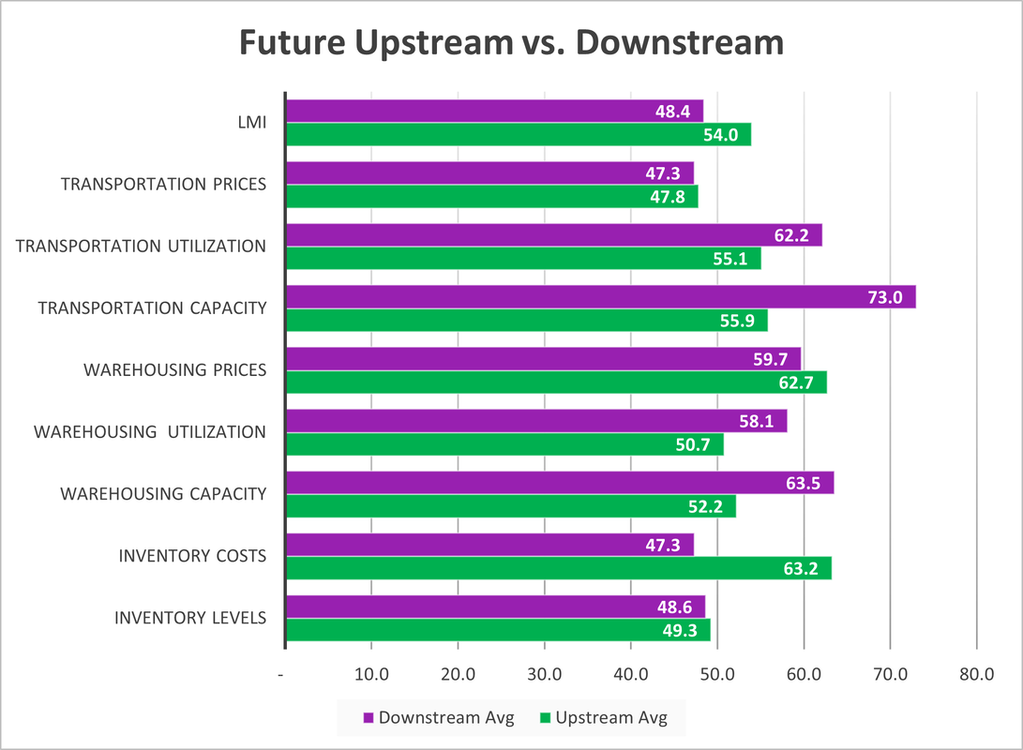
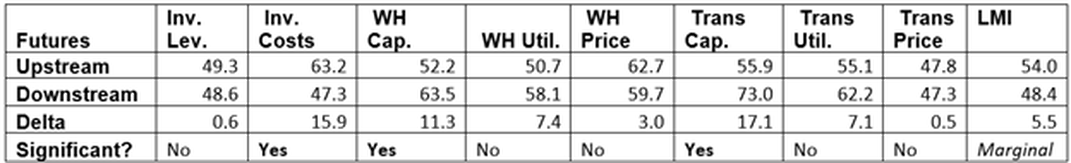
Interestingly Upstream (green bars) respondents are expecting growth (54.0) in the overall index while their Downstream (purple bars) counterparts predict contraction (48.4) over the next 12 months.- This is largely due to the significantly higher levels of Warehousing (52.2 to 63.5) and Transportation Capacity (55.9 to 73.0) that Downstream firms are expecting to come online, which they predict will lead to significantly lower Inventory Costs (47.3 to 63.2). Both Upstream and Downstream firms expect overall Inventory Levels to decrease, the fact that Downstream firms believe this will happen for them at a lower cost and with more capacity available suggests that their inventories will remain somewhat dynamic – with higher rates of turnover than what we may see Upstream.
Historic Logistics Managers’ Index Scores
This period’s along with prior readings from the last two years of the LMI are presented table below:
This period’s along with prior readings from the last two years of the LMI are presented table below:
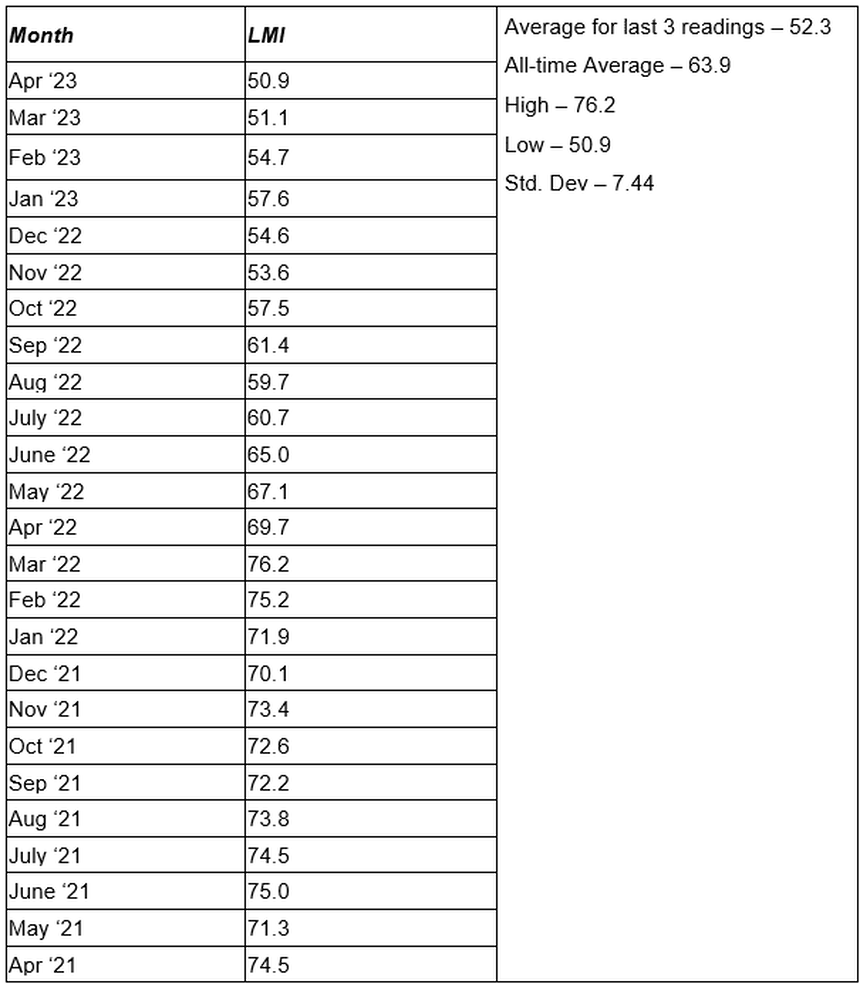
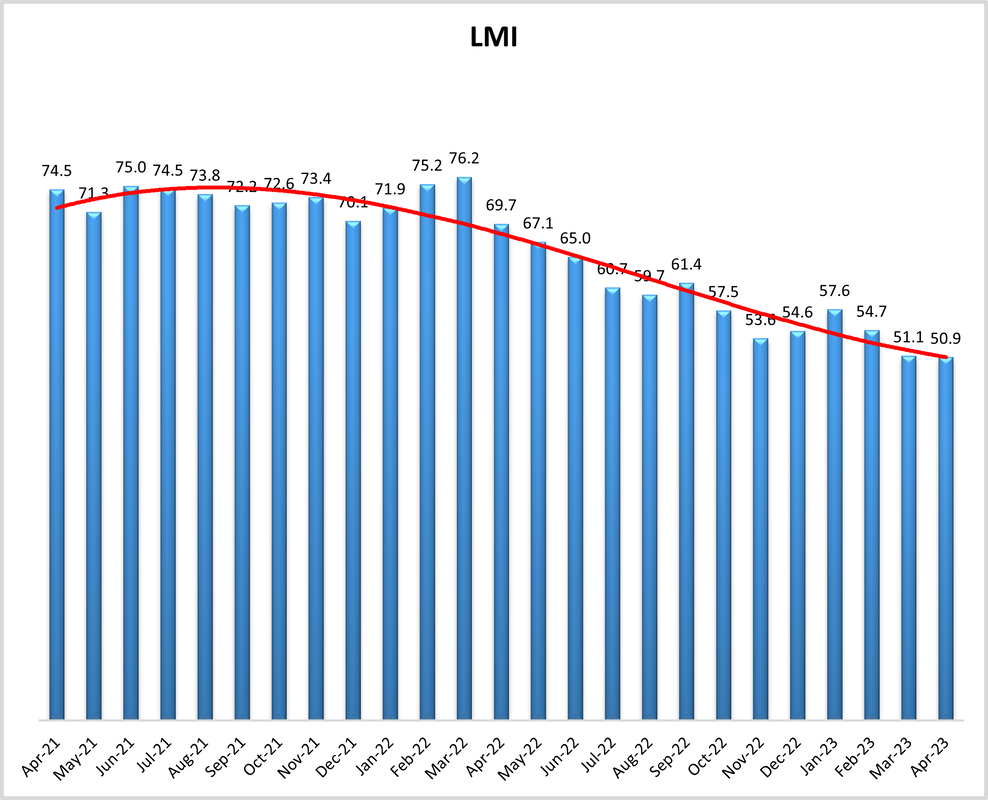
LMI®
The overall LMI fell for third consecutive month in April down slightly (-0.2) to a reading of 50.9 from March’s reading of 51.1. This is the all-time lowest reading for the overall index in the history of the LMI, and the second consecutive month that a new nadir has been reached. This month’s reading was brought down by the continued slowing of inventory and warehousing metrics – with Warehousing Utilization in particular dropping by 9.9 points. The LMI actually moved into contraction territory in the second half of April as it was propelled by the significant dip in Inventory Levels. Regular seasonality would suggest that things should pick up a bit in May, but If firms continue to shed inventory at this pace and Upstream firms continue to be slow to replenish large bulk goods then it is possible we will see the first-ever instance of contraction in the overall index.
Respondents expect this feeble rate of growth to continue over the next 12 months, predicting an expansion rate of 51.1, down (-1.6) from March’s future prediction of 52.7. The all-time average for the overall index is 63.9 (pre-COVD average was 61.9). If these predictions are accurate, the doldrums the industry is currently in could be continuing throughout 2023.
Inventory Levels
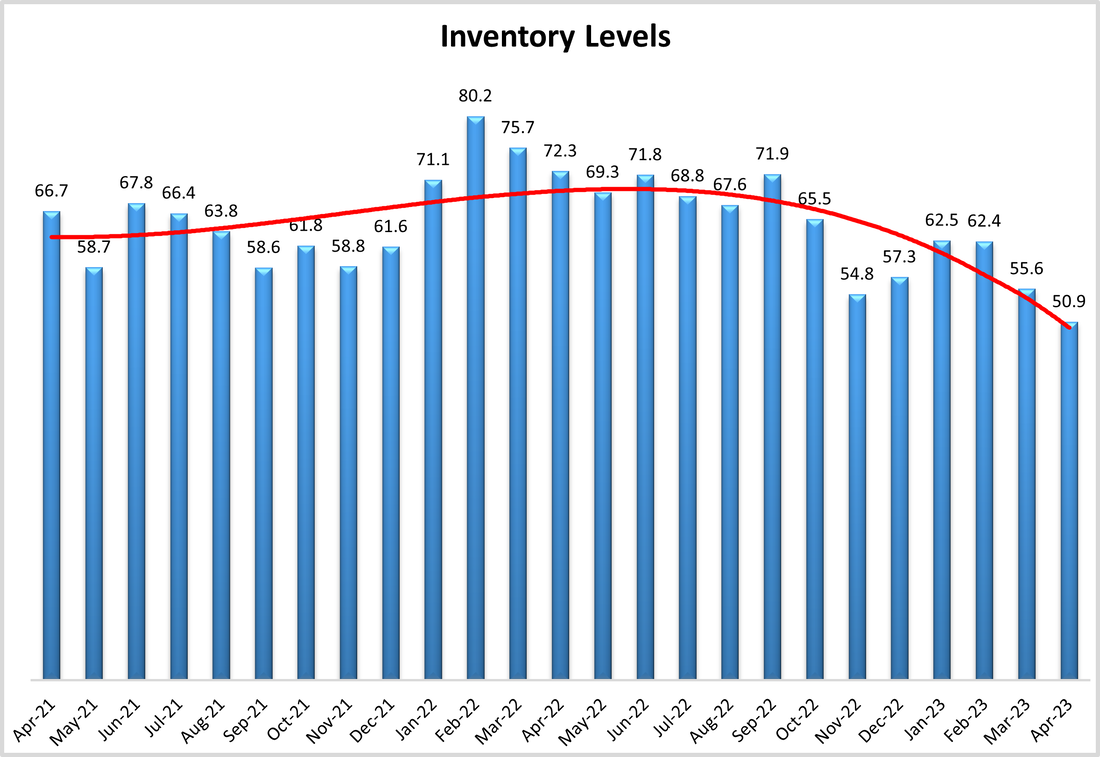
The Inventory Level value is 55.6, down (-6.8) from February’s reading of 62.4., almost identical (+0.1) to January’s reading of 62.5. This is 20.1 points lower than the same time last year, and down 5.9 from two years ago. Retailers continue to add inventory faster than others, as Downstream respondents reported modest inventory growth, while Upstream showed a slight contraction (55.4 vs 49.3). Curiously, Inventory levels plummeted significantly in April, going expanding at 63.3 in the first half of the month to contracting at a rate of 42.6 in the back half. If we see this trend continue into May, then we will see the first overall contraction in Inventory levels since February 2020 when inbound cargo shipments were slowed by a combination of the Chinese New Year and the earlier COVID-19 outbreak in China.
When asked to predict what conditions will be like 12 months from now, respondents predict inventory to actually contract at a value of 49.1, down (-5.1) from March’s future prediction of 54.2, down slightly from last month’s 55.7. Looking at the graph, the trendline is predicting a steep reduction in the index value, but respondents are predicting the value a year from now to be same as the current value.
Inventory Costs
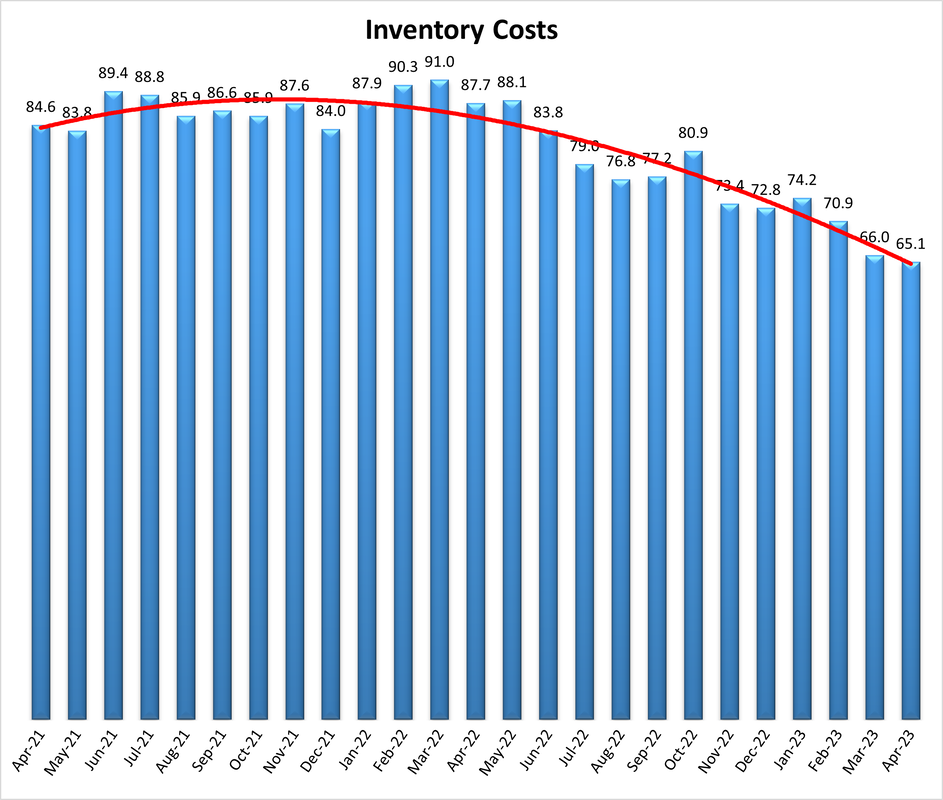
The current Inventory Costs index value reads in at 65.1, down (-0.9) from March’s reading of 66.0. This is down by 22.6 points from a year ago when Inventory Costs read in at 87.7. Perhaps reflecting the higher costs of warehousing, Upstream respondents reported higher Inventory Cost numbers by 6.4 points, (67.2 vs 60.8). If we compare early vs late responses, early responses were higher than later responses, but only by 7.0 points, a much less dramatic change than what we saw above for Inventory Levels (68.9 to 61.9).
Above, we saw that respondents expect inventory levels to decrease slightly over the next 12 months, this is not the case for Inventory Costs which are predicted to expand at a rate of 57.9. This is down (-4.1) from March’s future reading of 62.0. Interestingly, Upstream respondents are anticipating solid rates of growth in Inventory Costs, whereas Downstream respondents are expecting some contraction (47.3) over the next 12 months.
Warehousing Capacity
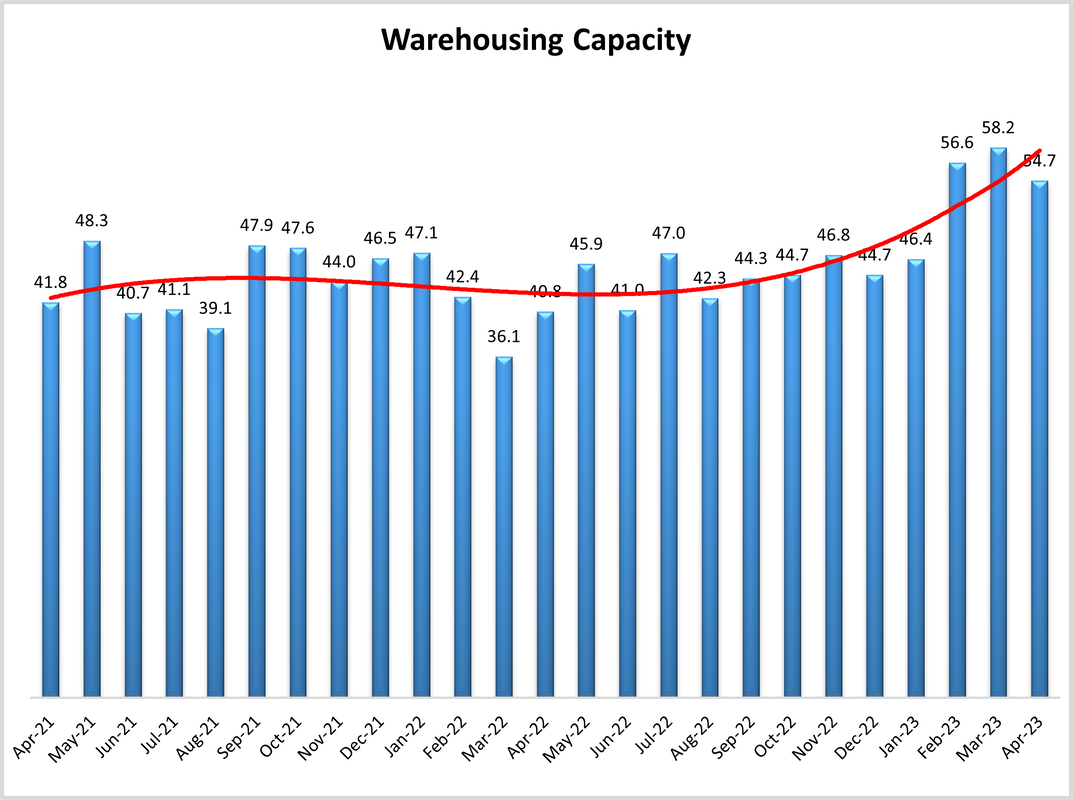
The Warehousing Capacity index registered at 54.7 in April of 2023, down (-3.5) from March’s reading of 58.2. While the rate of growth has slowed, this marks three consecutive months of expansion coming on the heels of 2.5 years of contraction. Capacity came close to contracting in the first half of April (51.1) before moving back towards a faster rate of expansion (58.3) in the second half. There does not seem to be any meaningful difference between the upstream (56.6) and downstream (52.7) numbers of this measurement, as this difference is not statistically significant. Thus, the evidence for softening of the growth in this space spears to be non-discriminant.
Looking forward at the next 12 months, respondents continue to expect available Warehousing Capacity to growth at a rate of 57.0, down (-6.8) from March’s future prediction of 63.8. In a reverse of what we observed last month, this is expected to be a significantly faster expansion for Downstream (73.0) than Upstream (55.9) firms.
Warehousing Utilization
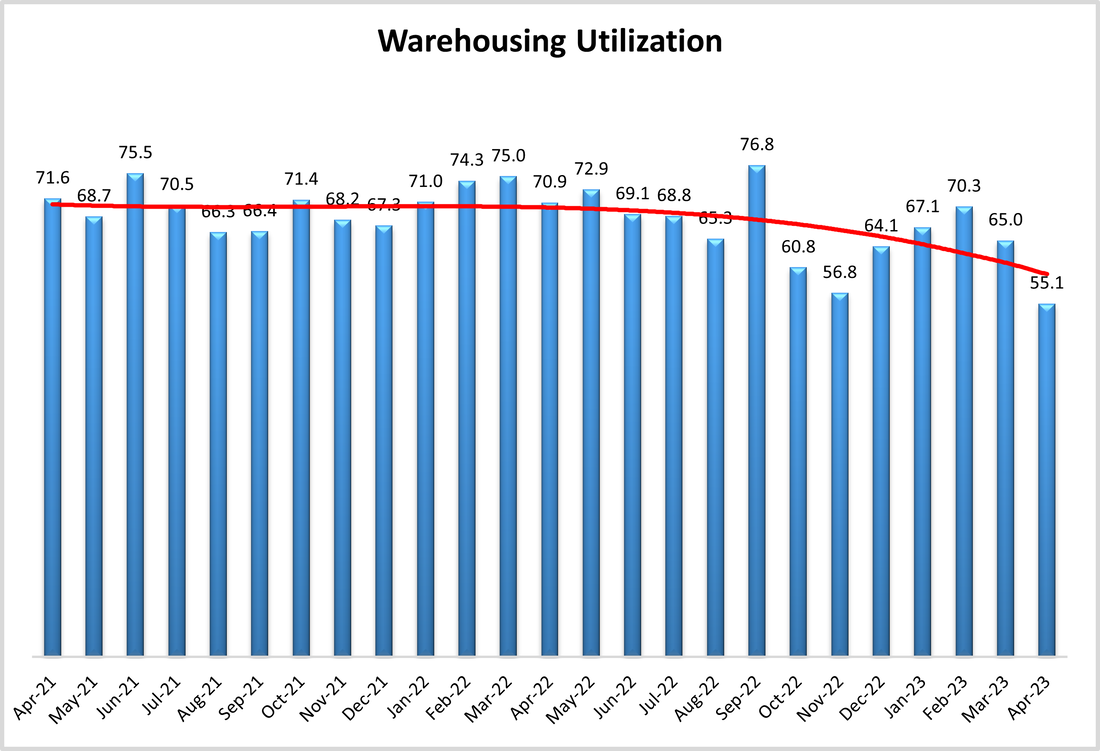
In line with the capacity indicator, the rate of growth for Warehousing Utilization reads in at 55.1 which is down (-9.9) from March’s reading of 65.0. This is a 15-point decrease from the reading one year ago, and 16 points down from the reading two years ago. Also noteworthy, is that from November of 2022 until now, the growth in Warehousing Utilization has been increasing at a rather strong rate, and this month breaks that trend, particularly as capacity continues to come online. While there is a 7.3-point difference between the Upstream (52.2) and Downstream (59.5) values for this measurement, this difference is not statistically significant, which could signal broad based increases in this space, though at a slower pace than last month. This was pronounced in the second half of April, when utilization rates came in a full 11.1-points lower than in the first half of the month (61.1 to 50.0), moving from expansion to no movement. Taken together, this may signal that either demand is decreasing or that perhaps market conditions are softening/shifting.
Looking forward at the next 12 months, the predicted Warehousing Utilization index is 53.8, down significantly (-11.5) from March’s future prediction of 65.3. Downstream firms are expecting a slightly higher (58.1 to 50.7) rate of expansion than their Upstream counterparts, but both still anticipate growth, suggesting that firms will be waiting to snap up whatever additional capacity does come online in 2023.
Warehousing Prices
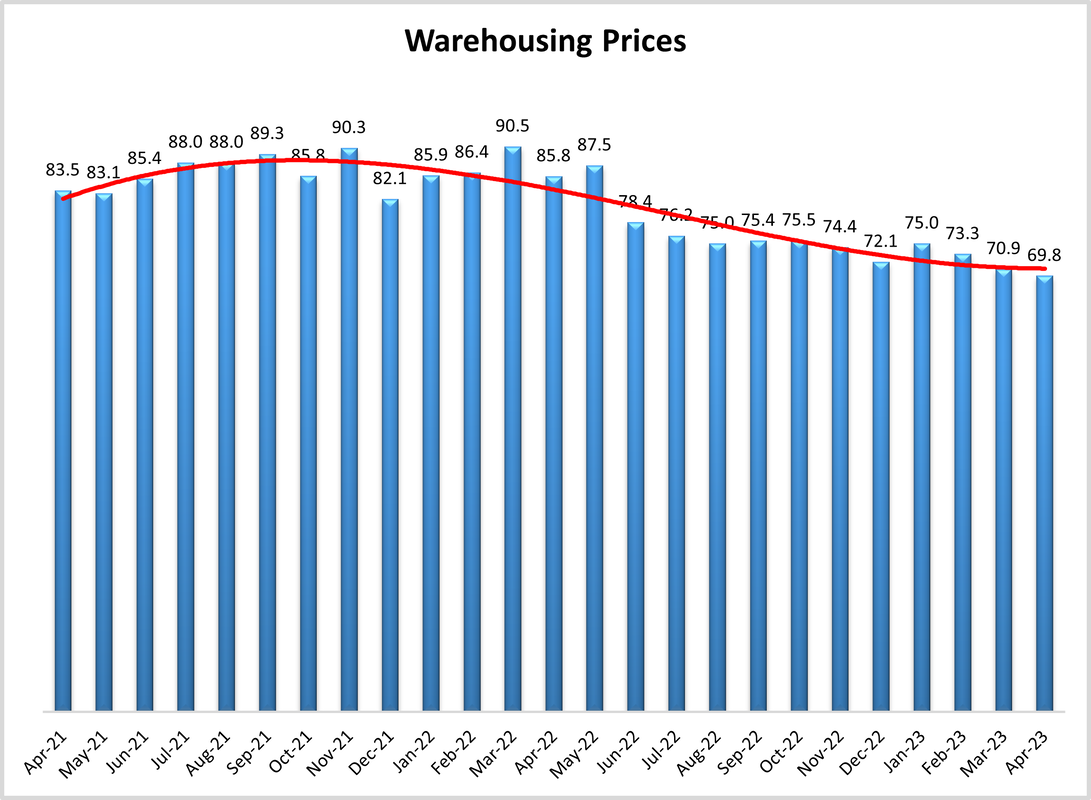
The Warehousing Price index reads in at 69.8, this is only down slightly (-0.9) from March’s reading of 70.9 but does mark the first time since August of 2020 that this metric came in below 70.0 which we consider to be a significant level of expansion. This shift, while less dramatic than those presented above, is still suggestive of an overall shift in the market. This signal is further evidenced based on the statistically significant, 11-point difference between the upstream (73.5) and downstream (63.5) responses. So, if combined with the warehousing data presented above it is possible to suggest that pricing may be the driving force behind capacity and utilization.
Future predictions suggest prices growth will continue to slow down as respondents are expecting prices to continue to grow at a rate of 61.9, down (-1.7) from March’s future prediction of 63.6. While this is still indicative of growth, the expected slowdown suggests that enough Warehousing Capacity will come online in 2023 to finally provide some relief to firms and consumers. Unlike what we observe in our other warehousing metrics, there is no noticeable split here between Upstream (62.7) and Downstream (57.7) predictions.
Transportation Capacity
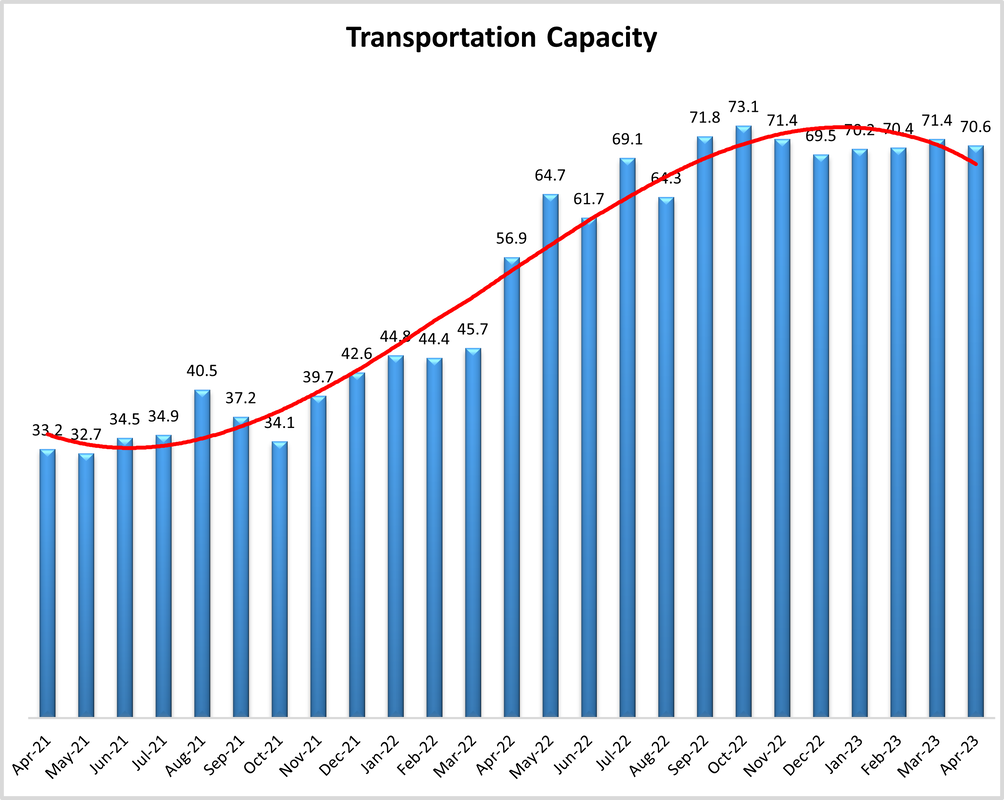
The Transportation Capacity Index registered 70.6 percent in April 2023. This constitutes a small decrease (-0.8) from the March reading of 71.4. Despite this small drop, the Transportation Capacity Index continues to remain elevated and near all-time highs. The Upstream Transportation Capacity index is significantly lower, reading in at 66.7 while the Downstream Index is 75.7. This split is consistent with what we have seen over the last few months in which there seems to be plenty of capacity for last-mile delivery perhaps reflecting the increasing rate at which consumers have returned to shopping at stores.
The future Transportation Capacity Index reads in at 62.6 and is expanding at a slower rate (-4.1) relative to March’s future prediction of 66.7. This is, however, quite consistent with February’s reading. Similar to the split noted above, Downstream firms are expecting significantly greater levels of available Transportation Capacity to come online than their Upstream counterparts at a rate of 73.0 to 55.9.
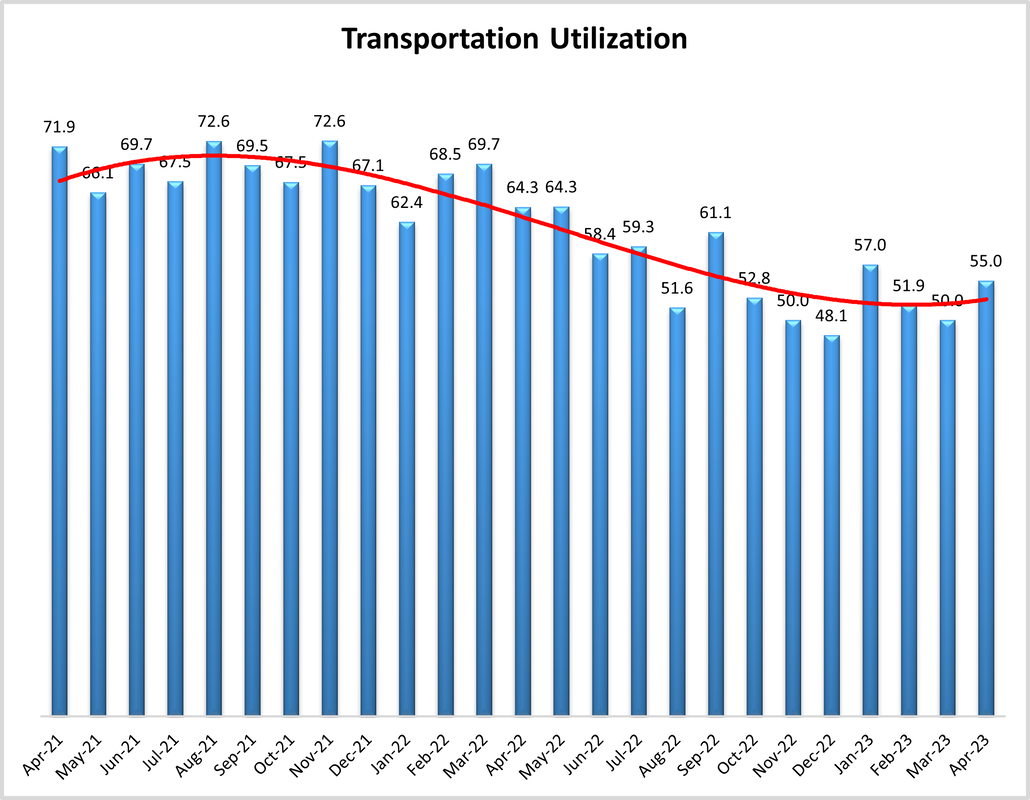
Transportation Utilization
The Transportation Capacity Index registered 70.6 percent in April 2023. This constitutes a small decrease (-0.8) from the March reading of 71.4. Despite this small drop, the Transportation Capacity Index continues to remain elevated and near all-time highs. The Upstream Transportation Capacity index is significantly lower, reading in at 66.7 while the Downstream Index is 75.7. This split is consistent with what we have seen over the last few months in which there seems to be plenty of capacity for last-mile delivery perhaps reflecting the increasing rate at which consumers have returned to shopping at stores.
The future Transportation Utilization Index reads in at 57.9, down (-2.4) from March’s future prediction of 59.5, and more than 10.0-points lower than what we saw in February. The expectations of future growth are diffused across the supply chain, with Downstream firms expecting slightly greater expansion rates (62.2) than Upstream firms (55.1).
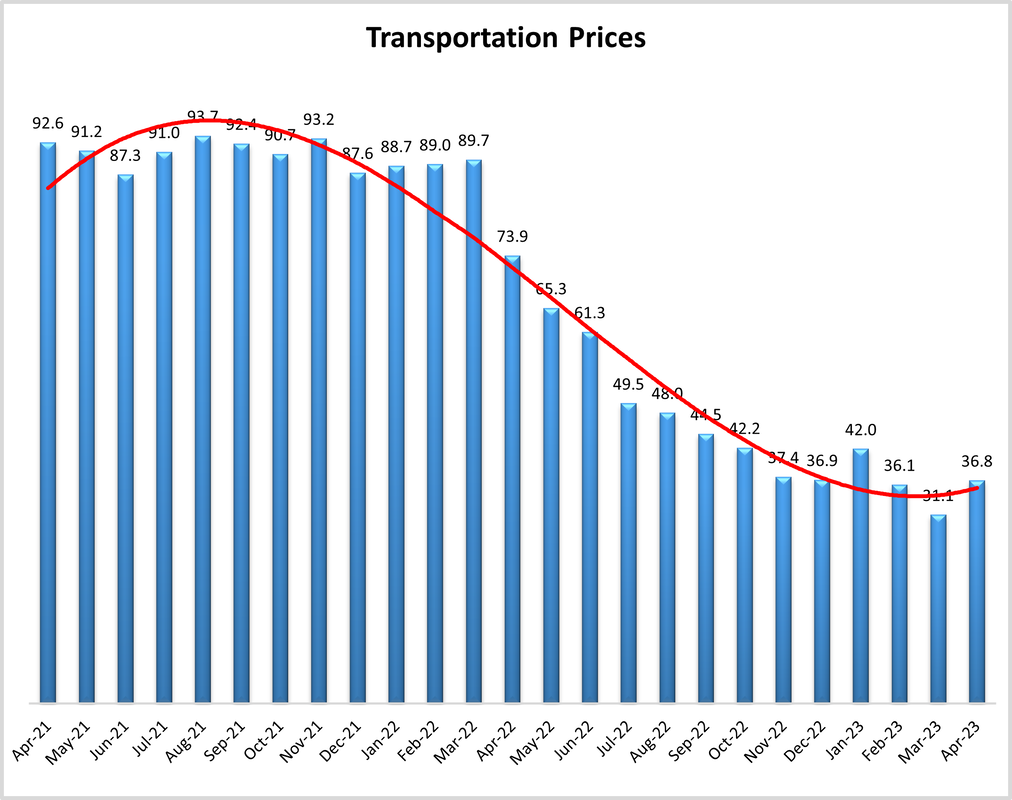
Transportation Prices
The Transportation Prices Index reads in at 36.8, up (5.7) from March’s all-time low reading of 31.1. The Transaction Prices Index rebounded somewhat but remains close to historical lows. The price index is relatively evenly distributed across the supply chain, with the Upstream index set at 35.7 and the Downstream Transportation Price index at 37.8. Transportation Prices contraction did slow down (+3.5) at a marginally significant rate in the second half of April. Whether or not we have hit the bottom of the market and will see price contraction slow and then eventually move back towards expansion remains to be seen.
The future index for Transportation Prices remains below the critical level and at 48.1, up slightly (+0.3) from March’s future prediction of 47.8. This is the second consecutive month that we have seen predictions of future contraction for this metric. The notion that Transportation Prices will contract slightly over the next 12 months is a position held by both our Upstream (47.8) and Downstream 47.3) respondents.
About This Report
The data presented herein are obtained from a survey of logistics supply executives based on information they have collected within their respective organizations. LMI® makes no representation, other than that stated within this release, regarding the individual company data collection procedures. The data should be compared to all other economic data sources when used in decision-making.
Data and Method of Presentation
Data for the Logistics Manager’s Index is collected in a monthly survey of leading logistics professionals. The respondents are CSCMP members working at the director-level or above. Upper-level managers are preferable as they are more likely to have macro-level information on trends in Inventory, Warehousing and Transportation trends within their firm. Data is also collected from subscribers to both DC Velocity and Supply Chain Quarterly as well. Respondents hail from firms working on all six continents, with the majority of them working at firms with annual revenues over a billion dollars. The industries represented in this respondent pool include, but are not limited to: Apparel, Automotive, Consumer Goods, Electronics, Food & Drug, Home Furnishings, Logistics, Shipping & Transportation, and Warehousing.
Respondents are asked to identify the monthly change across each of the eight metrics collected in this survey (Inventory Levels, Inventory Costs, Warehousing Capacity, Warehousing Utilization, Warehousing Prices, Transportation Capacity, Transportation Utilization, and Transportation Prices). In addition, they also forecast future trends for each metric ranging over the next 12 months. The raw data is then analyzed using a diffusion index. Diffusion Indexes measure how widely something is diffused or spread across a group. The Bureau of Labor Statistics has been using a diffusion index for the Current Employment Statics program since 1974, and the Institute for Supply Management (ISM) has been using a diffusion index to compute the Purchasing Managers Index since 1948. The ISM Index of New Orders is considered a Leading Economic Indicator.
We compute the Diffusion Index as follows:
PD = Percentage of respondents saying the category is Declining,
PU = Percentage of respondents saying the category is Unchanged,
PI = Percentage of respondents saying the category is Increasing,
Diffusion Index = 0.0 * PD + 0.5 * PU + 1.0 * PI
For example, if 25 say the category is declining, 38 say it is unchanged, and 37 say it is increasing, we would calculate an index value of 0*0.25 + 0.5*0.38 + 1.0*0.37 = 0 + 0.19 + 0.37 = 0.56, and the index is increasing overall. For an index value above 0.5 indicates the category is increasing, a value below 0.5 indicates it is decreasing, and a value of 0.5 means the category is unchanged. When a full year’s worth of data has been collected, adjustments will be made for seasonal factors as well.
Logistics Managers Index
Requests for permission to reproduce or distribute Logistics Managers Index Content can be made by contacting in writing at: Dale S. Rogers, WP Carey School of Business, Tempe, Arizona 85287, or by emailing dale.rogers@asu.edu Subject: Content Request.
The authors of the Logistics Managers Index shall not have any liability, duty, or obligation for or relating to the Logistics Managers Index Content or other information contained herein, any errors, inaccuracies, omissions or delays in providing any Logistics Managers Index Content, or for any actions taken in reliance thereon. In no event shall the authors of the Logistics Managers Index be liable for any special, incidental, or consequential damages, arising out of the use of the Logistics Managers Index. Logistics Managers Index, and LMI® are registered trademarks.
About The Logistics Manager’s Index®
The Logistics Manager’s Index (LMI) is a joint project between researchers from Arizona State University, Colorado State University, University of Nevada, Reno, Florida Atlantic University, and Rutgers University, supported by CSCMP. It is authored by Zac Rogers Ph.D., Steven Carnovale Ph.D., Shen Yeniyurt Ph.D., Ron Lembke Ph.D., and Dale Rogers Ph.D.