FOR RELEASE: Tuesday, November 7th, 2023
Contact:
Zac Rogers, Ph.D.
Logistics Manager’s Index Analyst
Associate Professor, Supply Chain Management
Department of Management
Colorado State University
Fort Collins, Colorado
(970) 491-0890
E-mail: Zac.Rogers@colostate.edu
http://www.logisticsindex.org
Twitter: @LogisticsIndex
Contact:
Zac Rogers, Ph.D.
Logistics Manager’s Index Analyst
Associate Professor, Supply Chain Management
Department of Management
Colorado State University
Fort Collins, Colorado
(970) 491-0890
E-mail: Zac.Rogers@colostate.edu
http://www.logisticsindex.org
Twitter: @LogisticsIndex
October 2023 Logistics Manager’s Index Report®
LMI® at 56.5
Growth is INCREASING AT AN INCREASING RATE for: Inventory Levels, Inventory Costs, Warehousing Utilization, Warehousing Prices, and Transportation Utilization.
Growth is INCREASING AT AN DECREASING RATE for: Warehousing Capacity
and Transportation Capacity
Transportation Prices ARE DECREASING
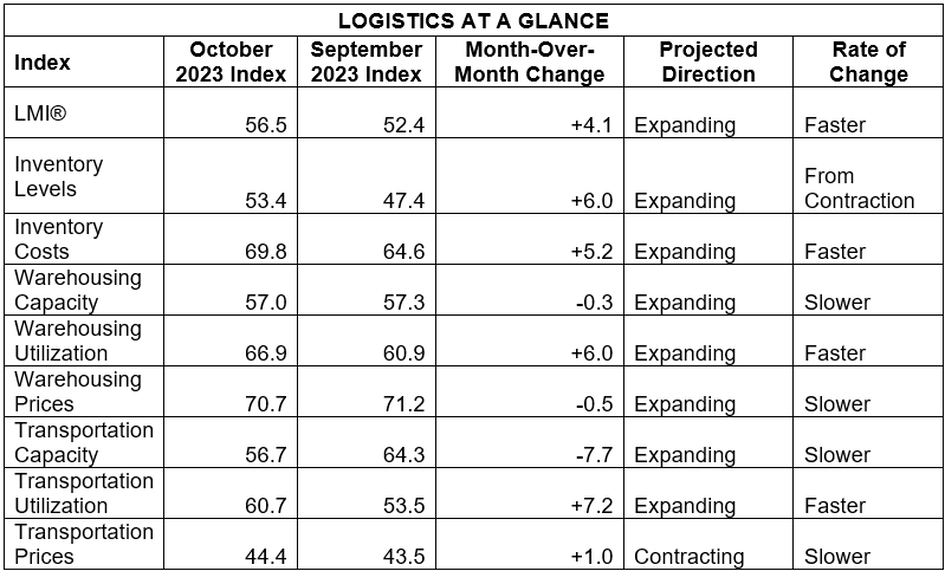
(Fort Collins, CO) — In October the Logistics Manager’s Index read in at 56.5, up (+4.1) from September’s reading of 52.4. This marks three consecutive months of expanding rates of growth, which come on the heels of three consecutive months of contraction. This is the fastest rate of expansion since January and only a point (1.0) off from last October’s expansion rate of 57.5. We had wondered whether last month’s shift from contraction to expansion was a one-time aberration or the start of a new trend. This second consecutive month of expansion provides some evidence for the latter. This change comes from increases in five of our eight sub-metrics, the board. We see a very slight (-0.5) decrease in expansion for Warehousing Prices and contraction for both capacity metrics (although it should be pointed out that decreasing capacity actually means increased activity). Transportation Prices continue to contract, but at 44.4 are doing so at their slowest rate since September 2022. These upward movements are catalyzed by Inventory Levels moving back to expansion (53.4) after five consecutive months of contraction. Whether increased inventories are temporary bursts of seasonal expansion or the sign of a larger move back towards stronger economic growth remains to be seen. What we can say however is that October’s inventory and overall index scores are a marked step forward for the logistics industry.
Researchers at Arizona State University, Colorado State University, Florida Atlantic University, Rutgers University, and the University of Nevada, Reno, and in conjunction with the Council of Supply Chain Management Professionals (CSCMP) issued this report today.
Results Overview
The LMI score is a combination of eight unique components that make up the logistics industry, including: inventory levels and costs, warehousing capacity, utilization, and prices, and transportation capacity, utilization, and prices. The LMI is calculated using a diffusion index, in which any reading above 50.0 indicates that logistics is expanding; a reading below 50.0 is indicative of a shrinking logistics industry. The latest results of the LMI summarize the responses of supply chain professionals collected in October 2023.
The overall LMI is up (+4.1) to 56.5, which represents the strongest rate of expansion for the logistics industry since January. An overall reading of 56.5 represents slow but unspectacular growth that is above the doldrums we had been seeing throughout much of this year, but still below the highs of the previous few years and slower than the all-time average expansion rate of 62.8. These slow steps towards recovery are similar to what we’re seeing in the overall U.S. economy. The 150,000 jobs added to the U.S. economy in October was the lowest number since June. Unemployment was also up slightly to 3.9% - although that is at least partially due to strikes by the United Auto Workers and Screen Actors’ Guild unions. The slowing job growth drove the stock market up as investors are beginning to hope that these are the first signs of the slowdown that will lead the Fed to not only stop raising interest rates, but to begin thinking about cutting them in 2024[1]. One of the tailwinds the Fed pointed to at their most recent meeting was the ongoing boom in supply. While they do concede that demand has continued to grow despite higher interest rates, it has not grown as quickly as supply. This increased availability has led to lower supply costs, facilitating the simultaneous job growth and a slowdown in inflation growth we have observed over the last year[2]. This supply boom is corroborated in our continued expansion of Inventory Levels, along with Warehousing and Transportation Capacity.
Unfortunately, this slow but steady recovery does not extend to the rest of the world. China continues to struggle with domestic demand – particularly now that many of the country's major mid-autumn holidays have wound down[3]. This combined with their ongoing issues in construction and the housing market will likely continue to weigh on the Chinese economy through 2023 and into 2024. There are signs of trouble in Europe as well as the combined GDP of the 20 Eurozone countries was down 0.4% in September – a far cry from the 4.9% growth in U.S. GDP in Q3. There is some connection here as EU imports of Chinese goods are down 15.4% year-over-year[4]. While the U.S. economy is continuing to boom, weakness in the other economic engines of the global economy could cause some headwinds – particularly in sectors like agriculture that are heavily reliant on exports. That being said, the divide between the U.S. and Chinese spheres of economic influence is growing as the world’s two largest economies continue to disentangle from one another[5].
Despite the increase in jobs in October, Transportation and Warehousing jobs were actually down 12,000 positions[1] – perhaps suggesting somewhat muted spending on goods in Q4. While it is not captured in U.S. job numbers, Danish shipping giant Maersk announced plans to cut 10,000 jobs as a response to poor performance in Q3. Maersk represents approximately a sixth of global shipping, and their troubles are representative of the issues being faced across international shipping markets. That being said, current international trade trends are somewhat nuanced. While the value of global trade is down, ton-kilometers – a new measure of the volume and distance of goods is up. This is at least partially because shipments of high-volume low-value goods such as commodities and agricultural products are up – potentially taking advantage of low shipping costs[6]. Interestingly, global air cargo tonnage is back up, only down 1% from last October. While that is a positive development, it is still quite a ways off the highs seen in 2021[7]. From 2021-22 there was a trend towards using U.S. import ports outside of Southern California. While imports through these alternate routes have remained relatively robust, a limiting factor on the use of Eastern and Gulf Coast ports in the U.S. is taking shape in the form of curbs on sailings through the Panama Canal. This October was the driest on record and Canal officials announced plans to cut sailings in half this winter due to insufficient water levels[8].
The question of whether or not the logistics industry will pick up in Q4 hinges on the potential for consumer spending and the requisite restocking of inventories that would require. Amazon’s recent profit growth has come as the result of their tech and AI sector, with their ecommerce sales continuing to remain somewhat flat but show some promise moving into Q4[9]. The possibility of growth is corroborated in a recent survey by 3PL Kenco that suggests that many shippers and retailers are expecting a busier peak-season for ecommerce firms than we saw in 2022, giving carriers some hope that business will continue to pick up through the end of 2023[10]. The National Retail Federation seems to affirm this prediction as well, forecasting that U.S. holiday spending will increase 3-4%, or $20 billion, from last year. FedEx CEO Raj Subramaniam believes that retailers have moved past destocking but is hesitant to say that restocking has begun[11]. There is some evidence of this in our numbers as Inventory Levels have moved back up (+6.0) to expansion territory at 53.4. This turn towards expansion comes after the last five months has seen contraction. Unsurprisingly, a move back towards expansion led to an increased (+5.2) rate of growth for Inventory Costs as well at a rate of 69.8. It will be important whether to observe if this trend continues. If inventories continue to expand it would be a sign that the excess bubble of goods that tormented the economy throughout 2022 is not only gone, but that firms are now ready to begin building inventories back up again.
Increased inventory volume would be welcome news in the freight market. The freight recession that started in May of last year will not end until there is equilibrium between supply and demand. While demand is up, it is only slightly so, which means capacity will need to continue to exit before the freight recession ends. The exit of Yellow’s capacity continues to be a boon to other carriers. ABF, XPO, and Saia are all reporting increased volume as they absorb Yellow’s 50,000 daily shipments. This has led some consultancy firms to speculate that the LTL sector is in slightly better shape than other segments of the freight market moving forward[12]. Convoy has also recently dropped out of the market with their customers – although not all of their assets being acquired by Flexport will also pull some capacity out of the market[13]. Lior Ron, CEO of Uber Freight believes that more exits may be on their way in the freight market, with continued high costs leading to a “tipping point” that may drive some small carriers out of the market[14].
The effect of this is clear in our numbers. The rate of growth for Transportation Capacity was down (-7.7) to 56.7. This represents a significant change for this metric as this is the slowest rate of growth we have tracked since March of 2022 – immediately after the Russian invasion of Ukraine and right as inflation was beginning to spin freight markets into recession. This dip was largely driven by movements in the second half of October, when the expansion rate came in at 52.3 (down from 60.6 in the first half of the month). This is the first time Transportation Capacity growth has been below 60.0 since April of 2022. Not coincidentally, October’s reading marks the first time Transportation Utilization has been above 60.0 since September of 2022, with rates up (+7.2) to 60.7. Despite all of this encouraging movement, Transportation Prices continue to contract (+1.0) at a rate of 44.4. This marks 16 consecutive months of contraction for this metric. However, it should be noted that the rate of contraction is down to its slowest pace since September of 2022, and that the rate of contraction was slower in the second half of October relative to the first half of the month (45.5 to 43.6). It is also important to note that Downstream firms saw actual growth in October, expanding at a rate of 53.7 – the first time we have tracked expansion anywhere in the supply chain in 2023. The freight recession is by no means over. But with all three of our transportation metrics hitting their most encouraging readings in over a year, we may be taking steps in the right direction (something our respondents seem to reaffirm in their future predictions presented below).
Despite the slight move back towards expansion in inventories, two of our three warehousing metrics remain fairly consistent with September’s readings. Warehousing Capacity is down slightly (-0.3) to 57.0. Warehousing Prices are also down (-0.5) to 70.7 – although it should be noted that any number above 70.0 is still a significant rate of growth. The biggest move we see is for Warehousing Utilization which is up (+6.0) to 66.9, which is its fastest rate of expansion since February when firms were still winding down their excess holiday inventories.
At this point it seems likely that the warehousing market will avoid any type of recession that would be similar to what we saw in transportation markets. Prologis raised its guidance for occupancy in mid-October, suggesting that they anticipate continued growth in the warehousing sector moving forward in 2024. U.S. vacancy rates were 4.1 in Q2 of 2023 – up from the all-time low of 2.9% at the same time in 2022 (when firms were flush with excess inventory). Despite this, leasing rates are still well-above pre-pandemic levels, perhaps suggesting that while the pandemic bubble has subsided, we are now back at a new normal[15] – one that is somewhat close to the expected growth we would have seen over the last three years had Covid not occurred. Interest rates have been a limiting factor in the industrial real estate market, if those do hold still or even begin to reside we could see another pick up in the sector. The other major challenge warehousing firms had been struggling with was labor. Interestingly, several thousand warehousing jobs were eliminated in October. At first glance it may appear counter-intuitive that warehousing employment is down even while the sector continues its streak of robust growth. An answer to this quandary may lie in the increasing use of automation as well as gig-economy workers inside distribution and fulfillment centers. The meteoric rise in warehouse wages we saw in 2021 and 2022 has slowed, but the use of gig work offers pickers and packers something valuable and rare in the warehousing industry – flexibility – making these positions more accessible for many and expanding the pool of potential workers[16].
Taking the warehousing metrics together, we see that while in previous months there was a more dramatic increase in Warehousing Capacity, the rate at which new capacity is entering the market is decreasing. This could be due to the fact that there has been a 4-month increase in the rate at which warehousing has been in demand with the utilization rate marking a 4-month increase of approximately 13 points. Furthermore, in the same 4-month period, three of those months was marked with an increase to the rate at which prices have been increasing. This is not surprising as in the past this report has observed a 1-3 month lag in the relationship between capacity increases (decreases) and price decreases (increases). Of course, compounding the increases in price are the persistent increases to transportation pricing and decreases to capacity while we enter into the holiday season.
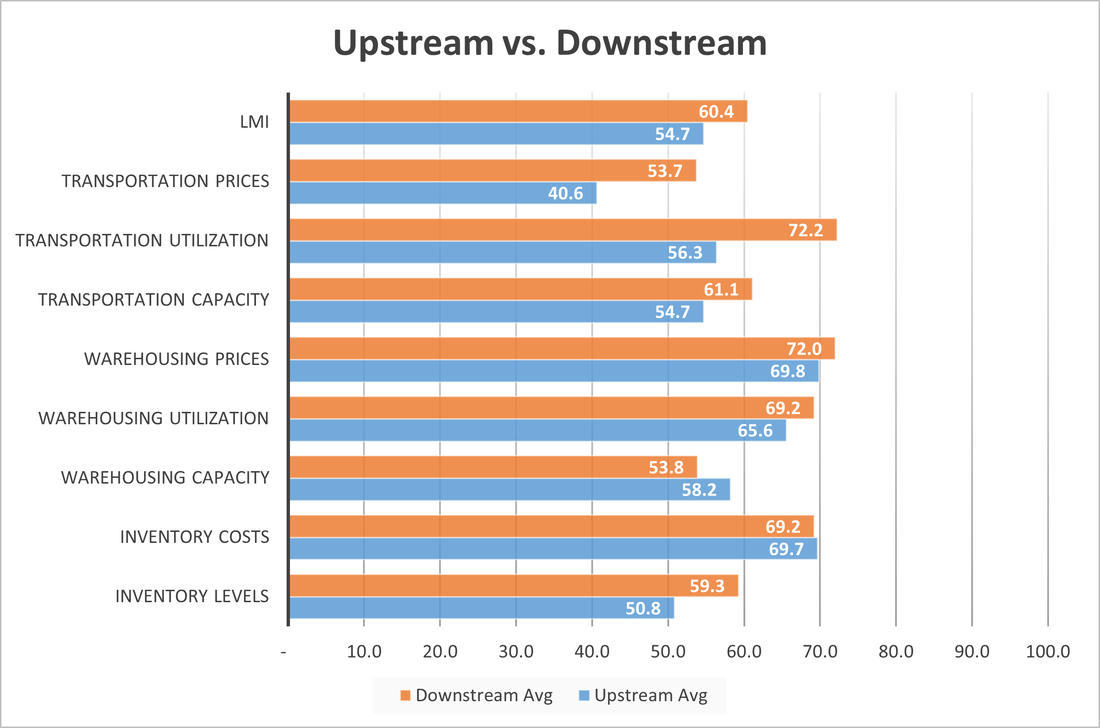
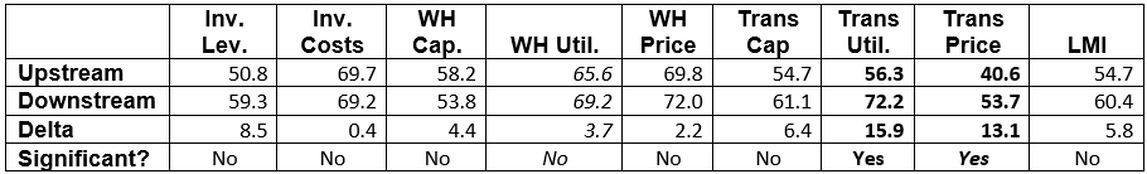
Continuing the trend we have observed throughout most of 2023 we see more activity from our Downstream (orange bars) than from our Upstream (blue bars) respondents. Unlike what we have observed throughout the Summer when we observed contraction throughout the supply chains, both Upstream (50.8) and Downstream (59.3) firms show expansion in Inventory Levels. This is the fastest expansion in months for either group and likely explains the significantly different rates of change for Transportation Utilization (72.2 Downstream vs. 56.3 Upstream) and Transportation Prices (53.7 Downstream vs. 40.6 Upstream). Transportation Prices are still contracting Upstream, but have now moved to expansion Downstream, which is the first expansion we have seen for this metric in 2023. Whether or not this portends the end of the freight recession predicted in our future metrics, or merely a slight bump due to seasonality, remains to be seen.
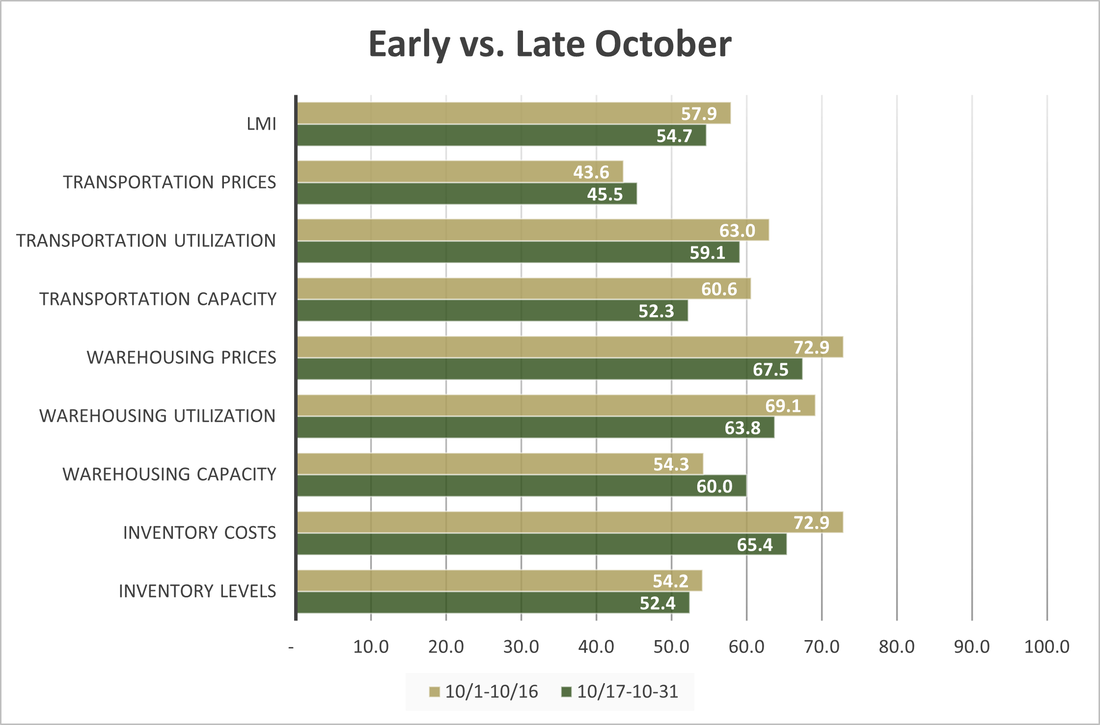
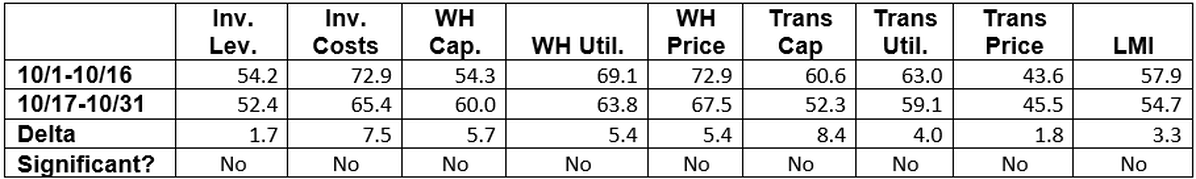
Responses varied slightly from early (gold bars) to late (green bars) October. There were no statistically significant differences, but we do observe some changes in speed. Inventory and Warehousing metrics were up early in October, as it seems goods were coming in faster and filling warehouses. The second half of October sees much less available Transportation Capacity. It is the biggest mover throughout the month at 8.4-points down and may be reflective of some of the closures we are now seeing. and a mildly slower (+1.8) contraction in Transportation Prices. This is the third of four months that Transportation Price growth has increased the back half of the month, suggesting that we continue to move closer to some sort of equilibrium in the freight market as capacity continues to exit.
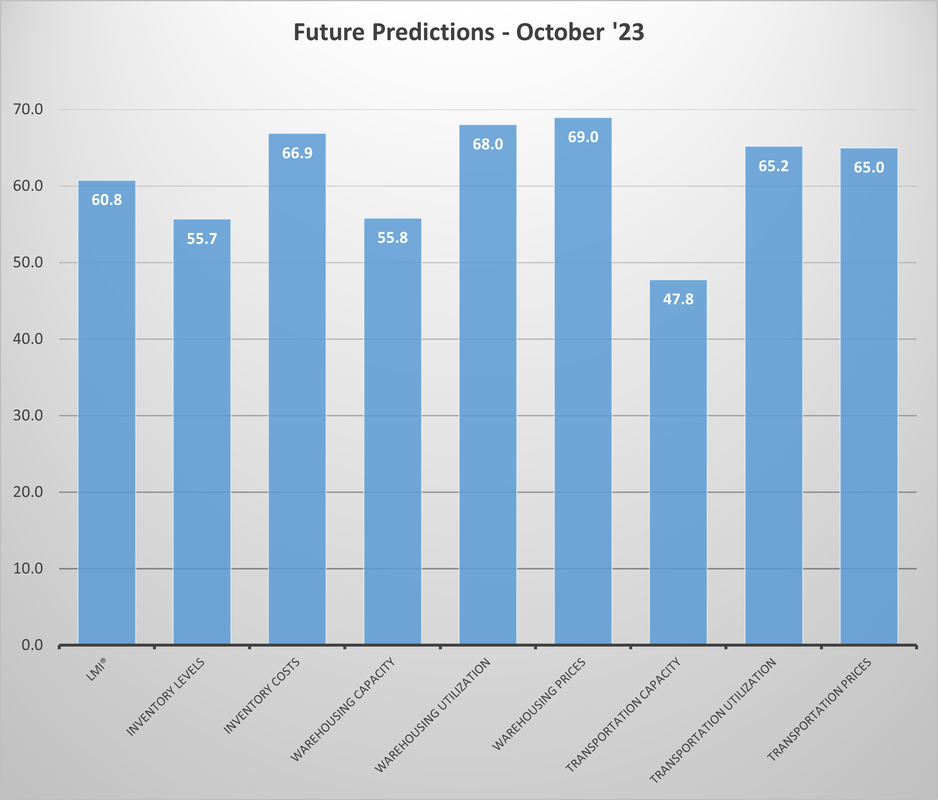
Respondents were asked to predict movement in the overall LMI and individual metrics 12 months from now. Future expectations were more optimistic about the future in October than they have been at any other point in 2023. The predicted reading of 60.8 for the overall index is driven by the expectation of an inversion of transportation markets, with respondents predicting contraction for Transportation Prices (47.8) and strong growth for both Transportation Utilization (65.2) and Prices (65.0). Respondents are also predicting continued, moderate (perhaps JIT-influenced) growth for Inventory Levels (55.7) with moderate-to-strong growth for Inventory Levels (66.9), Warehousing Utilization (68.0), and Warehousing Prices (69.0). These predictions would represent a recovery in the freight market and a move back towards more traditional lean inventory practices.
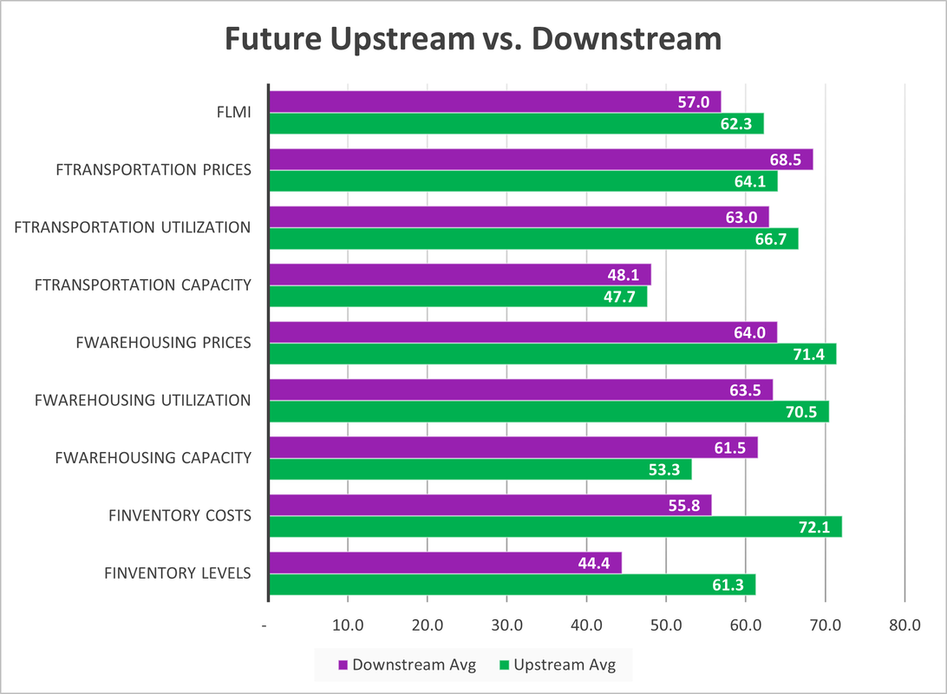
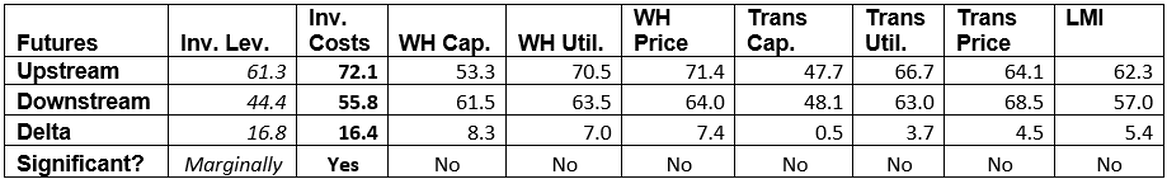
As has been the case through most of 2023, optimism regarding future changes comes from our Downstream (purple bars) more than from their Upstream (green bars) counterparts. Downstream firms are expecting marginally higher growth for Inventory Levels at a level of 61.3 to a continued contraction of 44.4 Upstream. This is associated with a significantly faster rate of expansion in Inventory Costs are a rate of 72.1 to 55.8. While there are no significant differences, we also see corresponding predictions of a tighter warehousing market for Downstream firms who seem to be expecting consumers to stay active, requiring the continued build and storage of inventories over the next year. For transportation we see relatively little difference between the two ends of the supply chain.
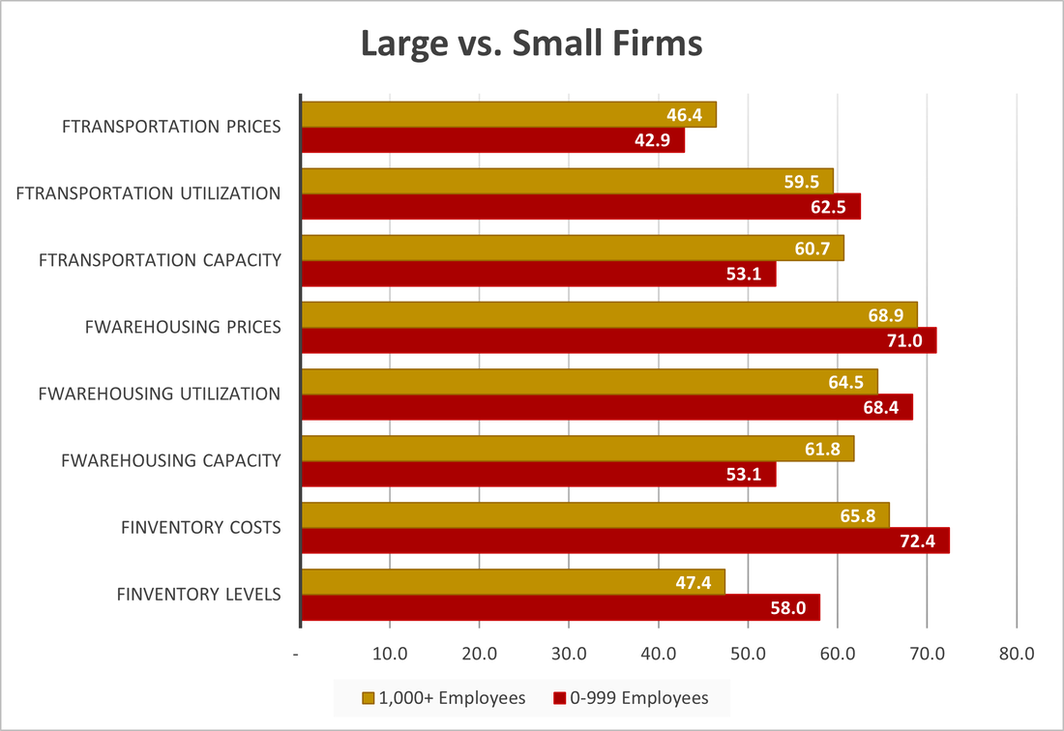
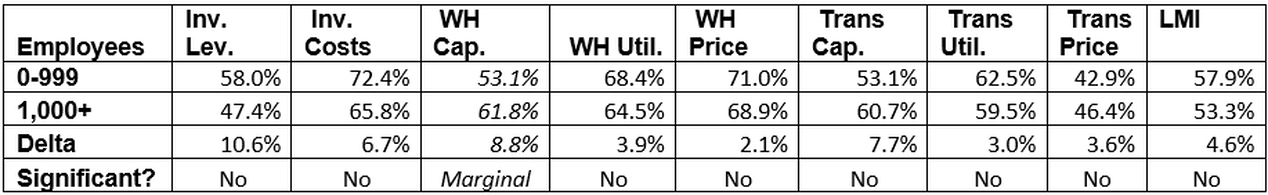
When comparing larger firms (those with 1,000 employees or more, represented by gold lines) and from smaller firms (those with 0-999 employees, represented by maroon lines) we see little difference – representing a continuation of trends from September. The only statistically significant difference between the two groups was regarding available Warehousing Capacity, which is expected to grow moderately for smaller firms (61.8) while holding almost steady (53.1) for larger firms. While the difference is not statistically significant, we also see a much slower expansion in available Transportation Capacity for larger (53.1) than smaller (60.7) firms. The differences in capacity are likely due to active growth in Inventory Levels for large firms (58.0) contrasting with slight contraction for smaller firms (47.4). Taken together, this suggests that larger firms are increasing inventories and utilizing significantly more capacity, moving towards equilibrium. Conversely, smaller firms have not begun to restock inventories and as a result are leaving significant capacity idle.
When comparing larger firms (those with 1,000 employees or more, represented by gold lines) and from smaller firms (those with 0-999 employees, represented by maroon lines) we see little difference – representing a continuation of trends from September. The only statistically significant difference between the two groups was regarding available Warehousing Capacity, which is expected to grow moderately for smaller firms (61.8) while holding almost steady (53.1) for larger firms. While the difference is not statistically significant, we also see a much slower expansion in available Transportation Capacity for larger (53.1) than smaller (60.7) firms. The differences in capacity are likely due to active growth in Inventory Levels for large firms (58.0) contrasting with slight contraction for smaller firms (47.4). Taken together, this suggests that larger firms are increasing inventories and utilizing significantly more capacity, moving towards equilibrium. Conversely, smaller firms have not begun to restock inventories and as a result are leaving significant capacity idle.
The index scores for each of the eight components of the Logistics Managers’ Index, as well as the overall index score, are presented in the table below. The overall index is expanding at a slightly faster rate (+4.1) of 56.5. Seven of the eight sub-components are expanding, including Inventory Levels which moved from contraction back to expansion at a rate of 53.4. The only metric that continues to contract is Transportation Prices at 44.4.
The index scores for each of the eight components of the Logistics Managers’ Index, as well as the overall index score, are presented in the table below. The overall index is expanding at a slightly faster rate (+4.1) of 56.5. Seven of the eight sub-components are expanding, including Inventory Levels which moved from contraction back to expansion at a rate of 53.4. The only metric that continues to contract is Transportation Prices at 44.4.
Historic Logistics Managers’ Index Scores
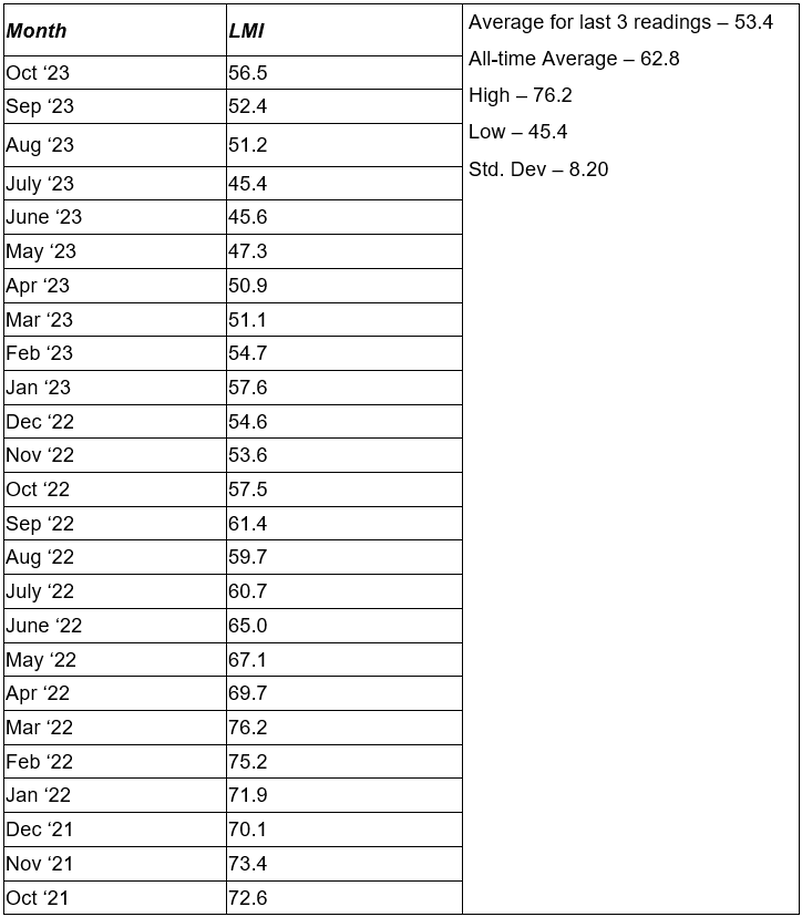
This period’s along with prior readings from the last two years of the LMI are presented table below:
This period’s along with prior readings from the last two years of the LMI are presented table below:
LMI®
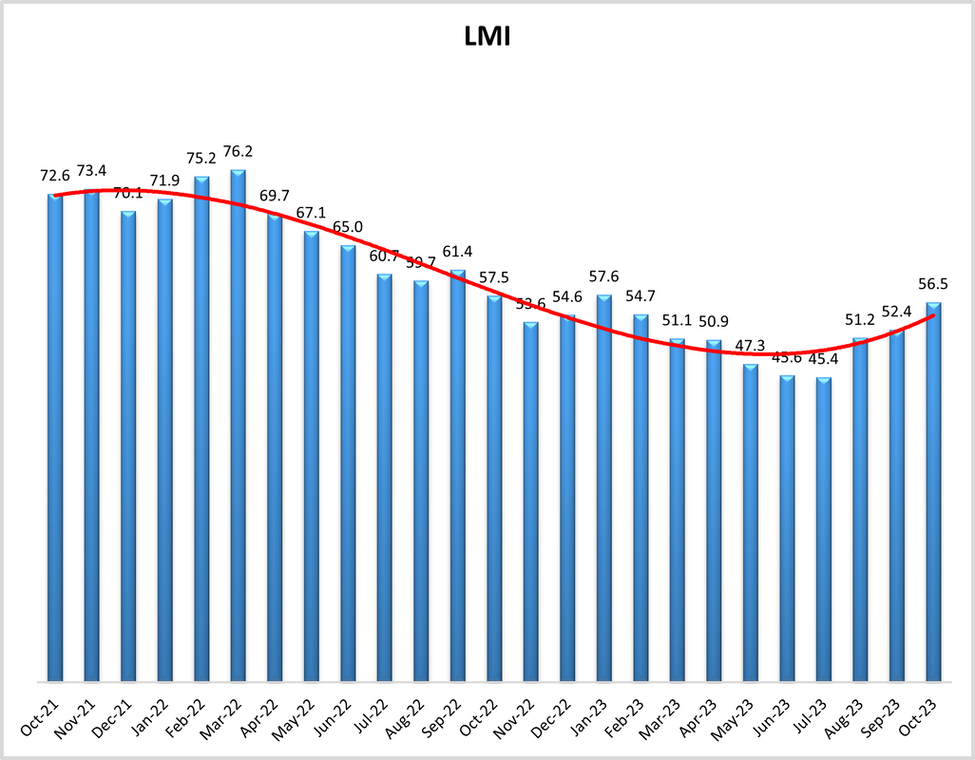
The overall index reads in at 56.5 in October, this is up (+4.1) from September’s reading of 52.4. This is the third straight month of expansion after three consecutive months of contraction. It is also the highest rate of growth since January when late holiday deliveries and hundreds of billions of dollars in returns inflated the logistics industry. This month’s expansion is influenced by Inventory Levels moving from expansion to contraction, utilization and prices growing or slowing their contraction, and slowing rates of expansion for both capacity metrics. If we look at the trendline, it seems that the overall index bottomed out this summer and is now climbing again. This climb is present for both Downstream (60.4) and Upstream (54.7) firms.
Respondents continue to get more and more optimistic regarding growth. The predicted expansion rate of 60.8 is up (+0.7) from September’s future prediction of 60.1. Both Upstream (57.0) and Downstream (62.3) firms predict steady growth that would be comparable to the all-time index average of 62.8.
Inventory Levels
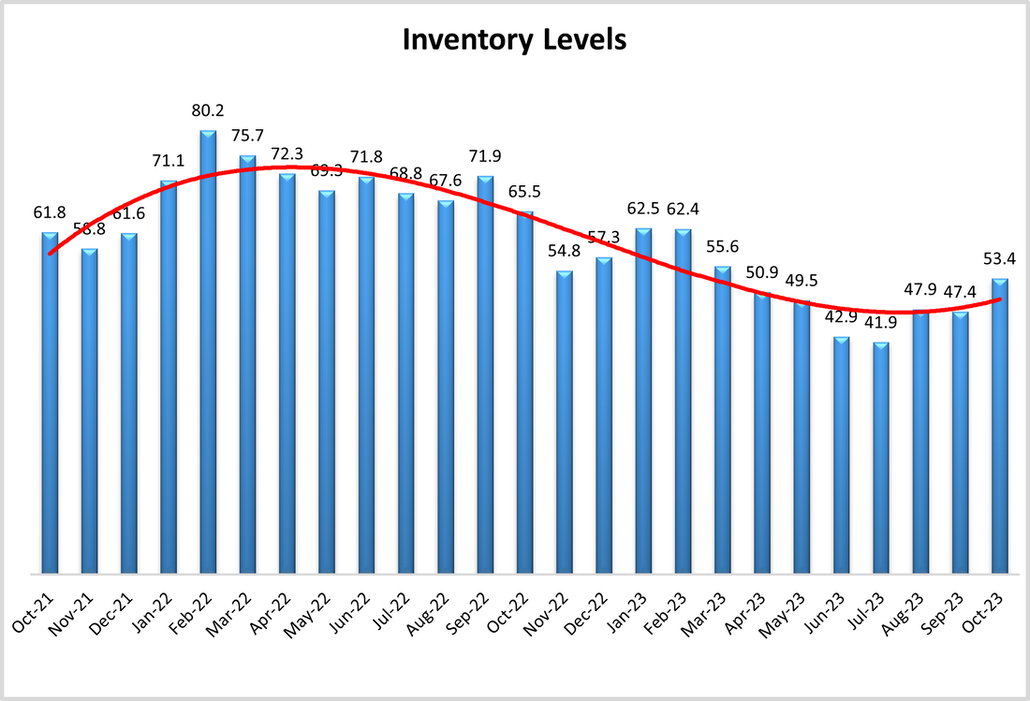
The Inventory Level value is 53.4 in October, up (+6.0) from September’s reading of 47.4. This is a marked change for Inventory Levels, which are not expanding following five consecutive months of decline. Despite the upturn, this value is 12.1 points lower than last year and 8.4 points lower than 2 years ago. This change suggests that firms have largely got through the excess inventories of the past 18 months and are now moving back towards the expansion we would expect at this time of the year. The rebuilding of inventory is more pronounced in certain sections of the supply chain. While both Upstream and Downstream respondents reported increases, Downstream expansion was much faster- (at a rate of 59.3 to 50.8). In a change from the last few months we also see more growth coming from smaller firms (58.0). Smaller firms had been hesitant to increase inventories due to their more tenuous cash position, but now seem to be building goods up again, perhaps signaling a vote of confidence for the consumer economy in Q4?
When asked to predict what conditions will be like 12 months from now, the average value is 55.7, up (+2.2) from September’s future prediction of 53.5. Interestingly, Upstream respondents predicted an increase of 61.3, while downstream respondents actually predicted a decrease of 44.4. There is a chance that this difference in expectations reflects a greater desire on the part of retailers to more carefully manage inventories.
Inventory Costs
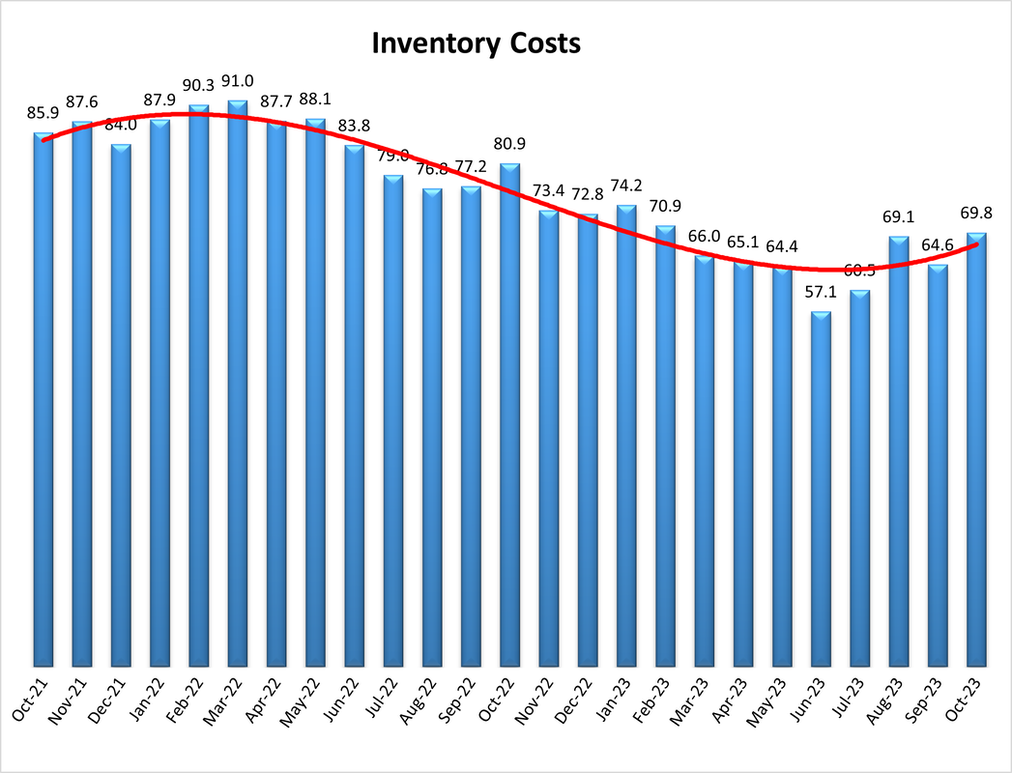
Inventory costs have increased to 69.8, the highest level since February, and are up (+5.2) from September’s reading of 64.6. These cost increases should be kept in perspective as it is 11.1 points lower than last year, and 16.1 points lower than two years ago. Upstream (69.7) and Downstream (69.2) respondents both observed very similar increases in costs. In keeping with their move to rebuild inventories, smaller firms did report Inventory Costs increasing at a faster rate than larger firms (72.4 to 65.8) in a shift from the trend of the last three months.
Predictions for future Inventory Cost growth are 66.9, down (-4.5) from September’s future prediction of 71.5. Interestingly, Upstream respondents’ future predictions averaged 72.1, while Downstream respondents averaged 55.8, a more modest increase. These increases were consistent with the expected increases in inventory.
Warehousing Capacity
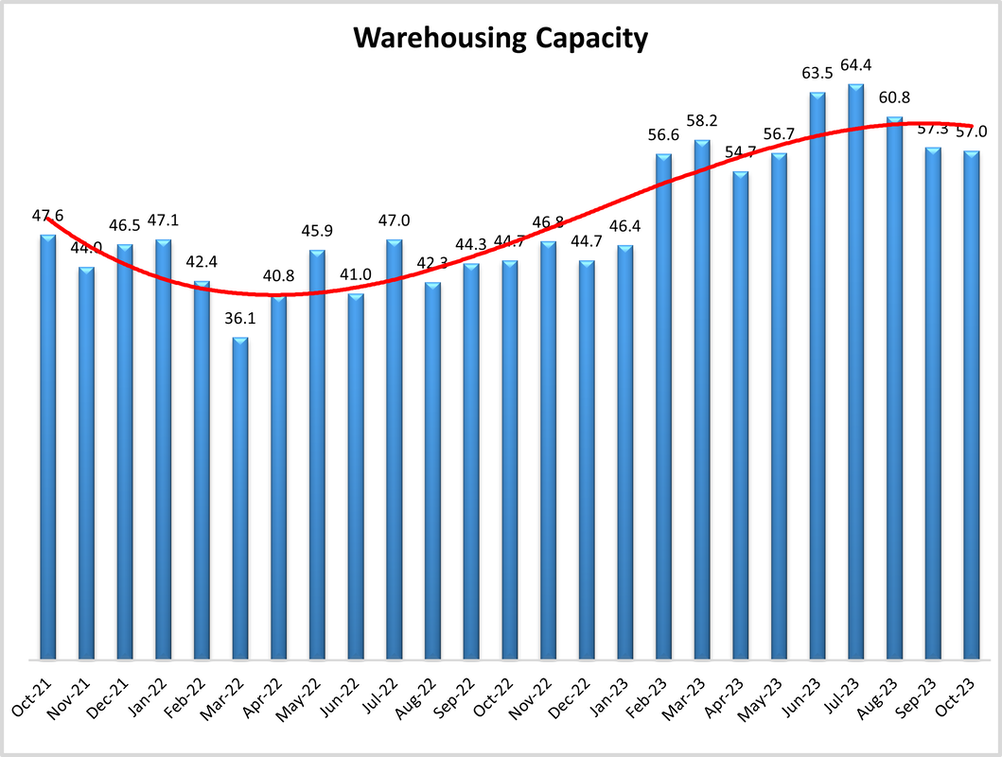
The Warehousing Capacity index for October 2023 registered at 57.0 and thus remained relatively unchanged from the previous month’s reading of 57.3, reflecting a .03 decrease. By contrast, this reading is up over 10 points from the reading one year ago and is also up by approximately 9-points from the reading two years ago. The split between Downstream (58.2) and Upstream (53.8) was not statistically significant. Furthermore, the difference between small (1-999 employees) firms (53.1) and large (>999) firms (61.8) demonstrated marginal statistical significance (p=.094). In addition, future predictions remain relatively stable as the one year out Upstream (53.3) and Downstream (61.5) remain relatively similar to the current readings.
Future predictions suggest capacity will come online slowly over the next year as respondents are expecting an expansion rate of 55.8, down (-8.4) from September’s prediction of 64.2. Future predictions vary by supply chain position, Downstream firms are predicting significant levels of growth rate a rate of 61.5 – 8.3-points higher than the more moderate growth rate of 53.3 predicted by Upstream firms. Although it should be noted that both of these numbers are down from last month as the warehousing market continues to settle.
Warehousing Utilization
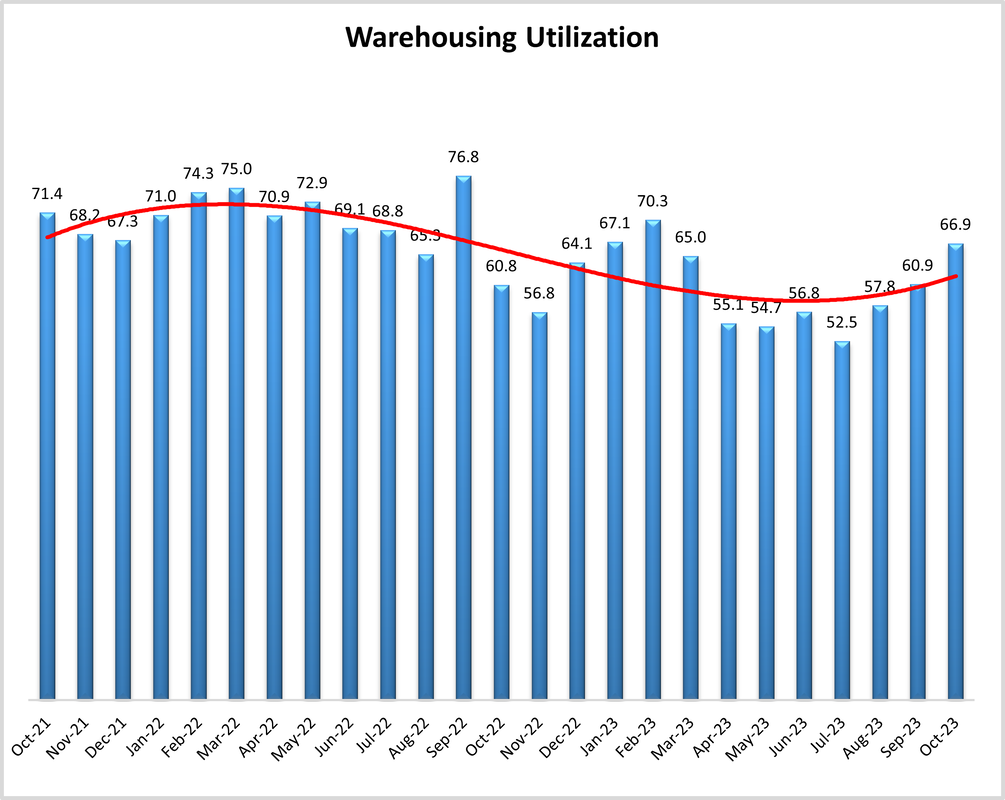
The Warehouse Utilization Index for October 2023 registered at 66.9 points, reflecting a 6-point increase from the reading one month ago. This reading is up 6.0 points from the reading one year ago and is (interestingly) down by 3.5 percentage points from the reading two years ago. The split between Downstream (65.6) and Upstream (69.2) was not statistically significant. On this measurement, difference between small firms (68.4) vs. large firms (64.5) was not statistically significant. In addition, future predictions remain relatively stable as the one year out Upstream (70.5) and Downstream (63.5) remain relatively similar to the current readings.
Looking forward to the next 12 months, the predicted Warehousing Utilization index is 68.0, up (+3.6) from September’s future prediction of 64.4. In a reverse from last month, Upstream firms are more bullish on future utilization, predicting an expansionary rate of 70.5 – 7.0 points higher than the Downstream prediction of 63.5-point growth.
Warehousing Prices
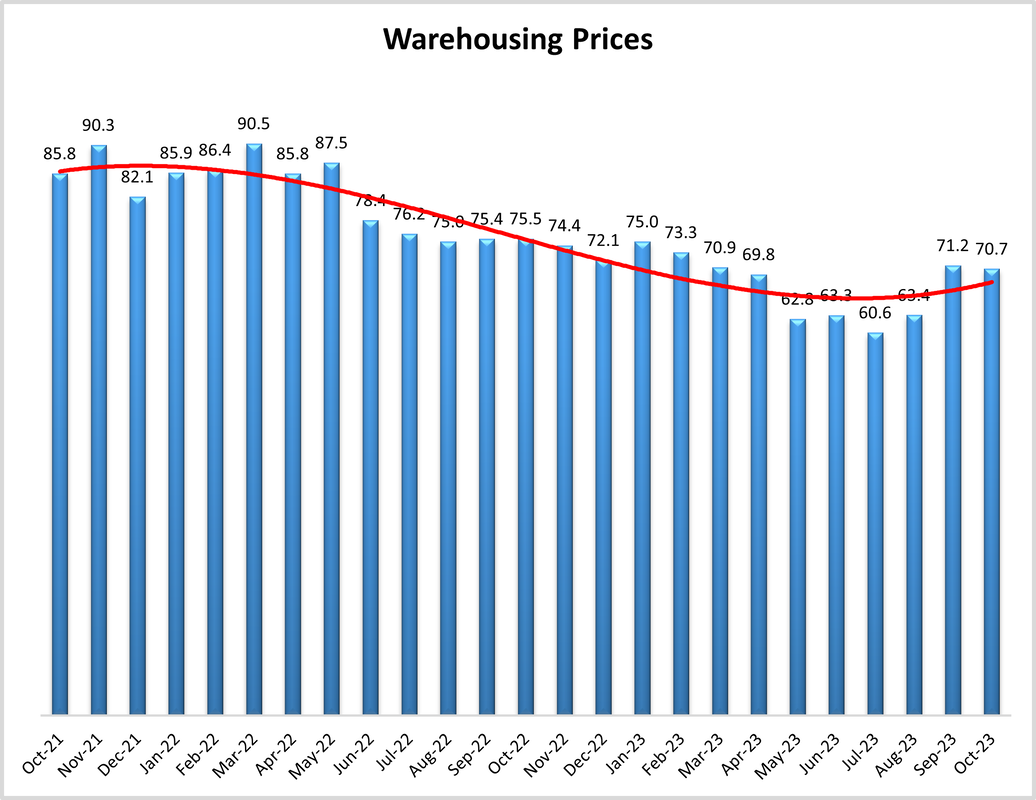
Finally, the Warehousing Prices Index for October 2023 registered at 70.7, reflecting a minimal decrease of 0.5 points from the reading from one month ago. By contrast, this measure is down just under 5 percentage points from the reading one year ago, and down over 15 percentage points from the reading two years ago. The split between Downstream (69.8) and Upstream (72.2) was not statistically significant. On this measurement, the difference between small firms (71.0) vs. large firms (68.9) was not statistically significant. In addition, future predictions remain relatively stable as the one year out Upstream (71.4) and Downstream (64.0) remain relatively similar to the current readings.
Future predictions suggest prices growth will remain healthy as respondents are expecting prices to continue to grow at a rate of 69.0, down (-2.5) from September’s future prediction of 71.5. This suggests that firms are planning to stock up on inventory over the next year and are anticipating that the costs of doing so will be high. Upstream firms expect a significantly faster rate of price expansion at 71.4 relative to Downstream predictions of 64.0
Transportation Capacity
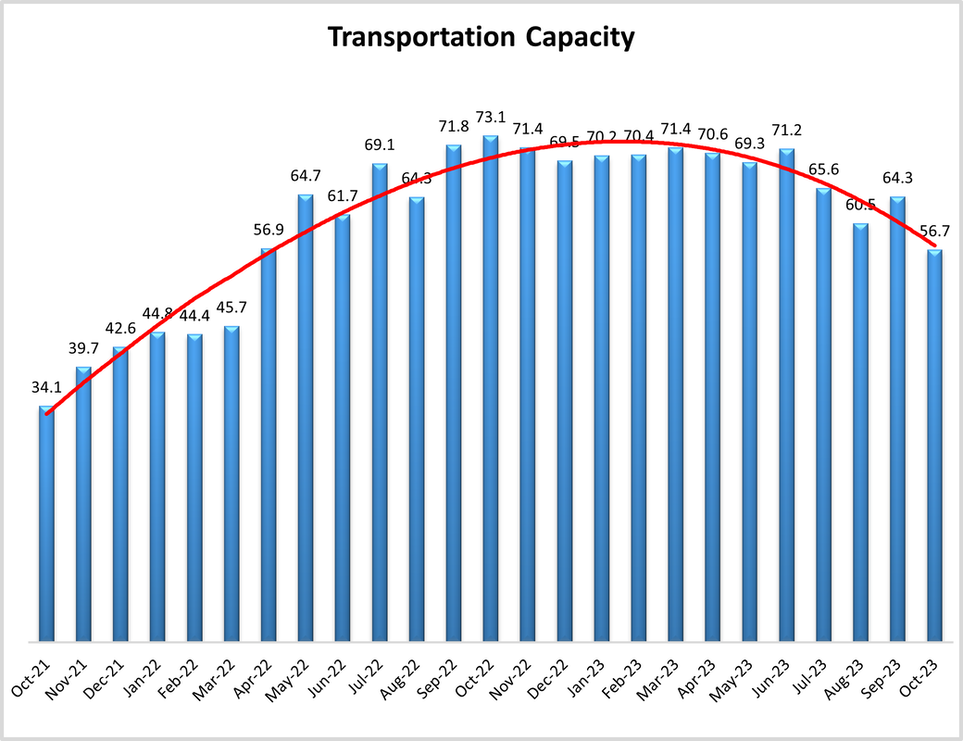
The Transportation Capacity Index registered 56.7 percent in October 2023. This constitutes a decrease of 7.6 percentage points from the September reading of 64.3. With this decrease the Transportation Capacity Index has resumed the downward trend that was experiencing for a few months. The decrease is even more significant for the Upstream Transportation Capacity Index which is at 54.7, while the Downstream index is at 61.1. As such, while the Transportation Capacity Index remains slightly above 50.0, and continues to indicate expansion, it can be concluded that the holiday season ramp up is putting increased pressures on transportation systems. Last time the Transportation Capacity Index was this low was in April 2022.
The future Transportation Capacity index indicates 47.8 corresponding to a drop of 6.1 points from the previous reading, falling below 50 and now indicating expectations of slight contraction in Transportation Capacity over the next 12 months. These expectations are relatively uniformly dispersed across the supply chains, with the Downstream future Transportation Capacity Index is at 48.1 while the Upstream future Transportation Capacity index indicates 47.7.
Transportation Utilization
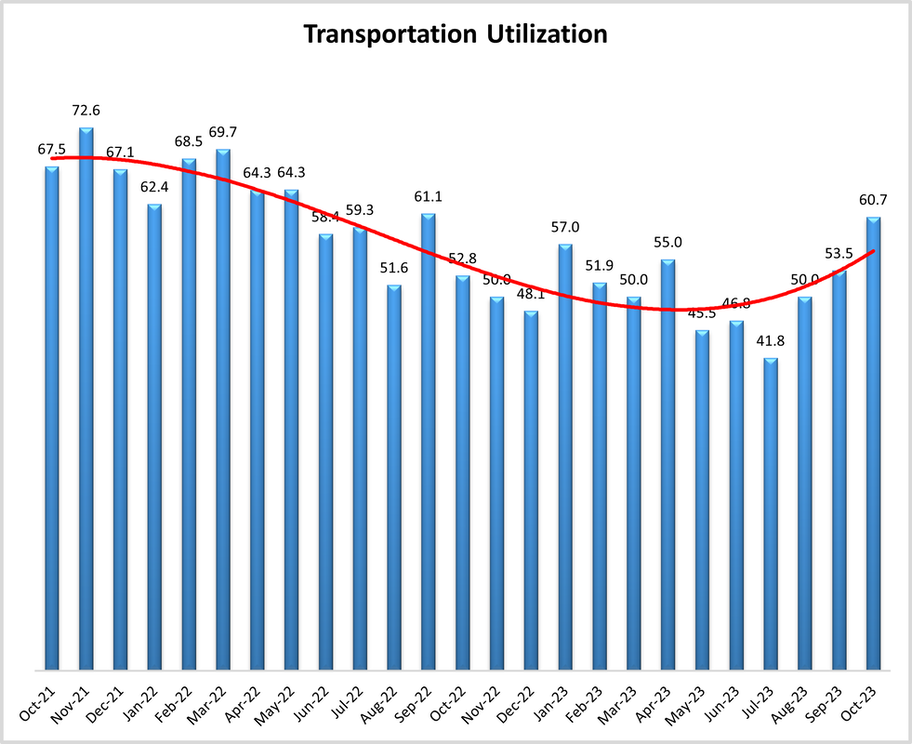
The Transportation Utilization Index registered 60.7 in October 2023. This corresponds to a jump of 7.2 percentage points from last month’s reading. With this increase, Transportation Utilization continues to rebound back and is now at the highest level registered since September 2022. The Downstream Transportation Utilization Index is now at 72.2, while the Upstream index is now at 56.3.
The future Transportation Utilization Index dropped slightly from the previous reading and indicates expansion at a 65.2 level for the next 12 months. As such expectations of increased Transportation Utilization remain strong and relatively uniformly dispersed across the supply chains with the Upstream where Transportation Utilization index at 66.7 and the Downstream at 63.0.
Transportation Prices
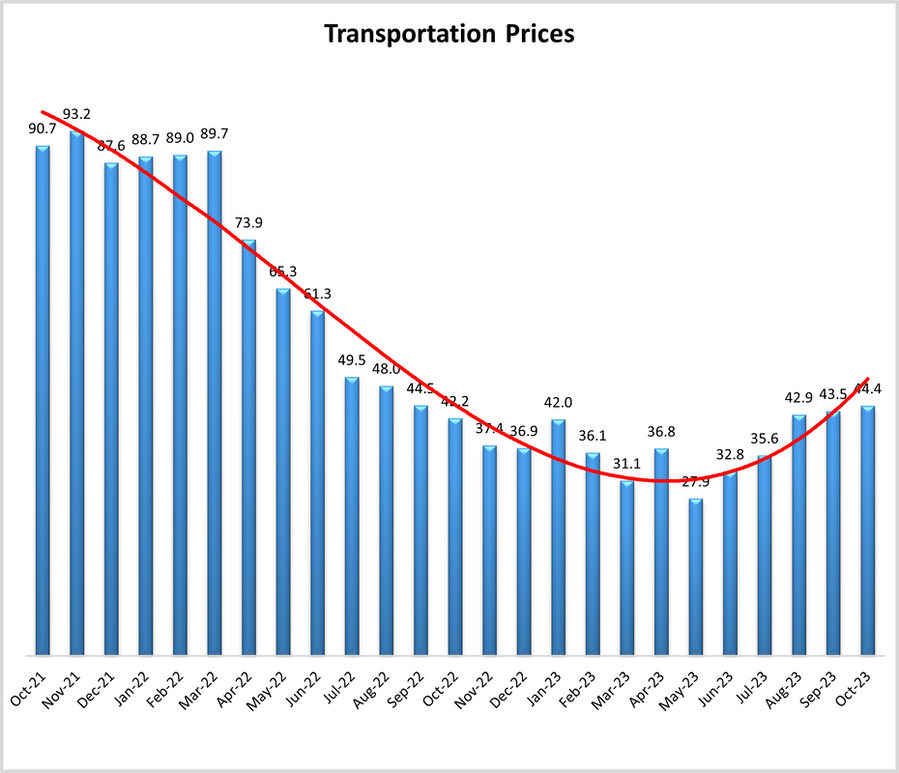
The Transportation Prices Index indicates 44.4 in October 2023, which corresponds to a small increase of 0.9 points from last month. Hence, the downward pressure on Transportation Prices eased a little more but the index remains in slight contraction territory. The Downstream Transportation Prices index is now at 53.7, indicating slightly increasing prices, while the Upstream index is at 40.6, continuing to indicate contraction.
The future index for Transportation Prices drops 4.4 points from last month and is now at 65.0, continuing to indicate expectations of higher Transportation Prices in the next 12 months. The Downstream Transportation Prices index is at 68.5 while the Upstream Transportation Prices Index is at 64.1, so expectations of higher Transportation Prices in the next 12 months are relatively uniformly distributed across the supply chain.
About This Report
The data presented herein are obtained from a survey of logistics supply executives based on information they have collected within their respective organizations. LMI® makes no representation, other than that stated within this release, regarding the individual company data collection procedures. The data should be compared to all other economic data sources when used in decision-making.
Data and Method of Presentation
Data for the Logistics Manager’s Index is collected in a monthly survey of leading logistics professionals. The respondents are CSCMP members working at the director-level or above. Upper-level managers are preferable as they are more likely to have macro-level information on trends in Inventory, Warehousing and Transportation trends within their firm. Data is also collected from subscribers to both DC Velocity and Supply Chain Quarterly as well. Respondents hail from firms working on all six continents, with the majority of them working at firms with annual revenues over a billion dollars. The industries represented in this respondent pool include, but are not limited to: Apparel, Automotive, Consumer Goods, Electronics, Food & Drug, Home Furnishings, Logistics, Shipping & Transportation, and Warehousing.
Respondents are asked to identify the monthly change across each of the eight metrics collected in this survey (Inventory Levels, Inventory Costs, Warehousing Capacity, Warehousing Utilization, Warehousing Prices, Transportation Capacity, Transportation Utilization, and Transportation Prices). In addition, they also forecast future trends for each metric ranging over the next 12 months. The raw data is then analyzed using a diffusion index. Diffusion Indexes measure how widely something is diffused or spread across a group. The Bureau of Labor Statistics has been using a diffusion index for the Current Employment Statics program since 1974, and the Institute for Supply Management (ISM) has been using a diffusion index to compute the Purchasing Managers Index since 1948. The ISM Index of New Orders is considered a Leading Economic Indicator.
We compute the Diffusion Index as follows:
PD = Percentage of respondents saying the category is Declining,
PU = Percentage of respondents saying the category is Unchanged,
PI = Percentage of respondents saying the category is Increasing,
Diffusion Index = 0.0 * PD + 0.5 * PU + 1.0 * PI
For example, if 25 say the category is declining, 38 say it is unchanged, and 37 say it is increasing, we would calculate an index value of 0*0.25 + 0.5*0.38 + 1.0*0.37 = 0 + 0.19 + 0.37 = 0.56, and the index is increasing overall. For an index value above 0.5 indicates the category is increasing, a value below 0.5 indicates it is decreasing, and a value of 0.5 means the category is unchanged. When a full year’s worth of data has been collected, adjustments will be made for seasonal factors as well.
Logistics Managers Index
Requests for permission to reproduce or distribute Logistics Managers Index Content can be made by contacting in writing at: Dale S. Rogers, WP Carey School of Business, Tempe, Arizona 85287, or by emailing dale.rogers@asu.edu Subject: Content Request.
The authors of the Logistics Managers Index shall not have any liability, duty, or obligation for or relating to the Logistics Managers Index Content or other information contained herein, any errors, inaccuracies, omissions or delays in providing any Logistics Managers Index Content, or for any actions taken in reliance thereon. In no event shall the authors of the Logistics Managers Index be liable for any special, incidental, or consequential damages, arising out of the use of the Logistics Managers Index. Logistics Managers Index, and LMI® are registered trademarks.
About The Logistics Manager’s Index®
The Logistics Manager’s Index (LMI) is a joint project between researchers from Arizona State University, Colorado State University, University of Nevada, Reno, Florida Atlantic University, and Rutgers University, supported by CSCMP. It is authored by Zac Rogers Ph.D., Steven Carnovale Ph.D., Shen Yeniyurt Ph.D., Ron Lembke Ph.D., and Dale Rogers Ph.D.
[1] Harrison, D., & Timiraos, N. (2023, November 3). Sharp U.S. Hiring Slowdown Signals Cooling Economy Ahead. WSJ. https://www.wsj.com/economy/jobs/what-to-watch-in-fridays-jobs-report-how-long-can-labor-market-keep-booming-344f5a1a
[2] Ip, G. (2023, November 1). Fed Takes Heart in a Supply-Side Boom. WSJ. https://www.wsj.com/economy/central-banking/fed-takes-heart-in-a-supply-side-boom-cff04568
[3] Taplin, N. (2023, November 1). Beware a Chinese Fall Stall. WSJ. https://www.wsj.com/economy/global/beware-a-chinese-fall-stall-c1c97e75
[4] Hannon, P. (2023, October 31). The U.S. and European Economies Are Diverging. WSJ. https://www.wsj.com/economy/global/the-u-s-and-european-economies-are-diverging-d56f2c8a
[5] Douglas, J., & Fairless, T. (2023, November 3). It’s U.S. vs. China in an Increasingly Divided World Economy. WSJ. https://www.wsj.com/economy/trade/economy-us-china-tariffs-trade-investment-1c58d24e
[6] Zumbrun, J. (2023, November 3). Is Globalization in Decline? A New Number Contradicts the Consensus. WSJ. https://www.wsj.com/economy/global/is-globalization-in-decline-a-new-number-contradicts-the-consensus-60df8ecf
[7] DC Velocity Staff. (2023a, November 2). Global air cargo tonnages stage slow recovery, but still lag far behind | DC Velocity. https://www.dcvelocity.com/articles/59069-global-air-cargo-tonnages-stage-slow-recovery-but-still-lag-far-behind
[8] Paris, C. (2023, November 1). Panama Canal to Halve Daily Sailings This Winter Due to Drought. WSJ. https://www.wsj.com/business/logistics/panama-canal-to-halve-daily-sailings-this-winter-due-to-drought-3bd70c79
[9] Herrera, S. (2023, October 26). Amazon’s Profit Triples as Sales Show Resilience Leading Into Holidays. WSJ. https://www.wsj.com/tech/amazon-amzn-q3-earnings-report-2023-9919947b
[10] DC Velocity Staff. (2023b, November 3). U.S. supply chain practitioners optimistic about 2023 e-commerce sales | DC Velocity. https://www.dcvelocity.com/articles/59071-us-supply-chain-practitioners-optimistic-about-2023-e-commerce-sales
[11] Solomon, M. (2023, November 2). US holiday spending to climb 3%-4% over 2022, NRF predicts. FreightWaves. https://www.freightwaves.com/news/us-holiday-spending-to-climb-3-4-over-2022-nrf-predicts
[12] Berger, P. (2023, October 31). Yellow’s Rivals Are Getting a Boost From the Trucker’s Demise. Wall Street Journal. https://www.wsj.com/articles/yellows-rivals-are-getting-a-boost-from-the-truckers-demise-aab6c759
[13] Young, L. (2023b, November 1). Flexport Buys Tech Backbone of Failed Startup Convoy. Wall Street Journal. https://www.wsj.com/articles/flexport-buys-tech-backbone-of-failed-startup-convoy-e6a1a8ea
[14] LaRocco, L. A. (2023, November 2). Uber Freight CEO says the shipping recession is at a new tipping point. CNBC. https://www.cnbc.com/2023/11/02/freight-recession-is-at-a-new-tipping-point-says-ubers-shipping-ceo.html
[15] Feuer, W. (2023, October 17). Prologis Says Industrial-Property Demand Remains Resilient. Wall Street Journal. https://www.wsj.com/articles/prologis-says-industrial-property-demand-remains-resilient-7ebef360
[16] Young, L. (2023a, October 10). Warehouses Are Calling In the Gig Workers. Wall Street Journal. https://www.wsj.com/articles/warehouses-are-calling-in-the-gig-workers-1357c685